JavaScript is a popular choice for a JavaScript flow chart and is one of the few languages that can be used for both front-end and back-end web application development. It is also conceivably the most flexible programming language. The evolution of this language has been quite remarkable, which is why JavaScript’s significance has increased over time. It is a preferred tool for data visualization among developers due to its functionalities. One example is creating a flow chart in JavaScript.
Today, many businesses seek a good flow chart in JavaScript for efficient data visualization. FusionCharts Suite is a popular web framework with which you can alter your chart per your preferences. It provides you with many advanced features. For example, you can add layers to the charts using annotations, modify the charts using properties, or build complex data visualizations using simple JavaScript code. This article will discuss the four best use cases of flow charts for such apps.
 An app can incorporate a JavaScript flowchart to visualize business operations. It may depict the entire business process with UML diagrams, the workflow in particular departments, or the steps involved in one particular operation. Your end-user requirements entirely determine your diagram’s scope.
 The goal of any flow chart is to make the necessary steps easier to visualize, which is crucial when managing a project. In addition, users can more effectively communicate how they plan to implement business requirements for a new process or application using flow charts.
They can also help you with a process analysis from start to finish. Additionally, each diagram includes tasks, the person responsible for completing them, and the inputs and outputs for each stage.
Furthermore, since the flow chart is meant to be clear and transparent, simple, jargon-free language is used. In addition, the steps are clear-cut and simple regardless of one’s level of expertise or knowledge. Flow charts assist in avoiding the omission of important inputs, outputs, and processes in this way.
The goal of any flow chart is to make the necessary steps easier to visualize, which is crucial when managing a project. In addition, users can more effectively communicate how they plan to implement business requirements for a new process or application using flow charts.
They can also help you with a process analysis from start to finish. Additionally, each diagram includes tasks, the person responsible for completing them, and the inputs and outputs for each stage.
Furthermore, since the flow chart is meant to be clear and transparent, simple, jargon-free language is used. In addition, the steps are clear-cut and simple regardless of one’s level of expertise or knowledge. Flow charts assist in avoiding the omission of important inputs, outputs, and processes in this way.
 As established above, flowcharts are very important for data sets visualization and are used extensively by developers today. Now, we will discuss the four best use cases.
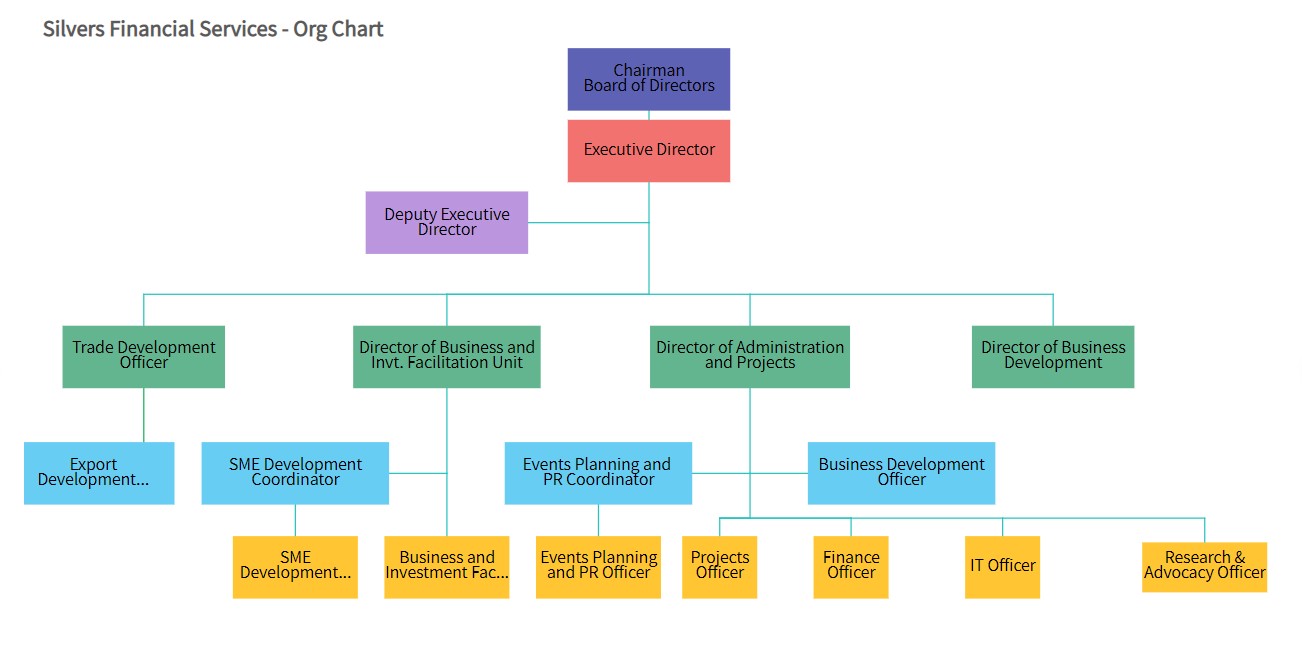 JavaScript flow charts make it possible to represent an organization’s hierarchy in a simple way. For example, these charts clarify who a specific team member should report to in case of an emergency, and the areas of responsibility for each employee. Unfortunately, such diagrams typically place the department head at the top.
Users of these business apps can visually inspect how various system components interact. For example, you can select one of the available chart types based on your business’s organizational structure.
A hierarchical/top-down organizational chart demonstrates the hierarchy of a given organization. These diagrams typically begin with the chairman, CEO, business owner, or department head. Next, all the people who work for that person are listed below. Finally, the relationships between the employees are represented by the line connecting each role in the chart. Small businesses can benefit from the diagrams described, because it is the simplest and doesn’t require complicated relationships.
As a result, this solution will satisfy the needs of a business with a small number of employees who all answer to a single manager. However, things become more difficult if supervisory staff and department heads need to be included in the graph.
JavaScript flow charts make it possible to represent an organization’s hierarchy in a simple way. For example, these charts clarify who a specific team member should report to in case of an emergency, and the areas of responsibility for each employee. Unfortunately, such diagrams typically place the department head at the top.
Users of these business apps can visually inspect how various system components interact. For example, you can select one of the available chart types based on your business’s organizational structure.
A hierarchical/top-down organizational chart demonstrates the hierarchy of a given organization. These diagrams typically begin with the chairman, CEO, business owner, or department head. Next, all the people who work for that person are listed below. Finally, the relationships between the employees are represented by the line connecting each role in the chart. Small businesses can benefit from the diagrams described, because it is the simplest and doesn’t require complicated relationships.
As a result, this solution will satisfy the needs of a business with a small number of employees who all answer to a single manager. However, things become more difficult if supervisory staff and department heads need to be included in the graph.
Table of Contents
What Is A JavaScript Flowchart?
An app can incorporate a JavaScript flowchart to visualize business operations. It may depict the entire business process with UML diagrams, the workflow in particular departments, or the steps involved in one particular operation. Your end-user requirements entirely determine your diagram’s scope.
What Is The Importance Of Flow Charts?
The goal of any flow chart is to make the necessary steps easier to visualize, which is crucial when managing a project. In addition, users can more effectively communicate how they plan to implement business requirements for a new process or application using flow charts.
They can also help you with a process analysis from start to finish. Additionally, each diagram includes tasks, the person responsible for completing them, and the inputs and outputs for each stage.
Furthermore, since the flow chart is meant to be clear and transparent, simple, jargon-free language is used. In addition, the steps are clear-cut and simple regardless of one’s level of expertise or knowledge. Flow charts assist in avoiding the omission of important inputs, outputs, and processes in this way.
What Are The Top Use Cases Of A Flow Chart In JavaScript Business Apps?
As established above, flowcharts are very important for data sets visualization and are used extensively by developers today. Now, we will discuss the four best use cases.
1. How Can You Do Data Visualization Of Business Processes With Flow Charts?
When business processes are properly visualized, it is possible to quickly assess the current situation and make crucial business decisions if adjustments are necessary. However, certain business properties must be kept in mind to ensure goal-oriented and informed communication. It will be helpful to gain an overview of the key APIs connected to the graphical representation of the employed business processes when you’re taking part in a business meeting to make business optimization changes. JavaScript diagrams can display all key business process properties on the diagram, giving stakeholders a quick overview of the entire process. JavaScript flowcharts could also be helpful for process-oriented risk management. For example, you can examine visual representations of process models. This ensures your company complies with local laws and regulations. Apart from that, you can also ensure that there are no potential risks of harm to your property or finances from a particular business process. Using data sets visualization tools, you can link risks to specific business activities, ensuring that process and risk definitions are aligned and highlighting all uncontrolled risks and potential problem areas.2. Can Flow Charts Represent The Hierarchy Of An Organization In An Intuitive Way?
JavaScript flow charts make it possible to represent an organization’s hierarchy in a simple way. For example, these charts clarify who a specific team member should report to in case of an emergency, and the areas of responsibility for each employee. Unfortunately, such diagrams typically place the department head at the top.
Users of these business apps can visually inspect how various system components interact. For example, you can select one of the available chart types based on your business’s organizational structure.
A hierarchical/top-down organizational chart demonstrates the hierarchy of a given organization. These diagrams typically begin with the chairman, CEO, business owner, or department head. Next, all the people who work for that person are listed below. Finally, the relationships between the employees are represented by the line connecting each role in the chart. Small businesses can benefit from the diagrams described, because it is the simplest and doesn’t require complicated relationships.
As a result, this solution will satisfy the needs of a business with a small number of employees who all answer to a single manager. However, things become more difficult if supervisory staff and department heads need to be included in the graph.