Have you ever spent hours buried in documentation, hunting for a specific piece of code? Or felt your enthusiasm fade while writing the same repetitive code for standard charts like bar charts or map charts? We understand – data visualization can be incredibly fulfilling, yet highly time-consuming.
Imagine if there were a way to streamline this process, allowing you to concentrate on the creative elements of data visualization. The advent of AI for Data Visualization is set to transform these areas, delivering unparalleled efficiency, accuracy, and user experience. AI shifts the tedious into the extraordinary, enabling you to fully embrace your creative potential.
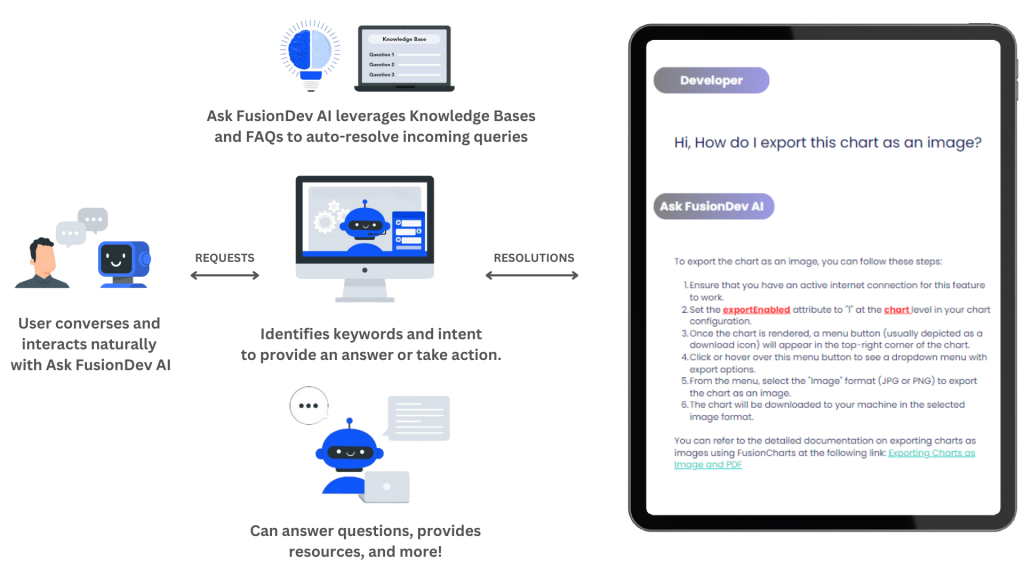 FusionCharts has introduced Ask FusionDev AI, an intelligent assistant that not only fetches API references but also suggests relevant chart examples, troubleshoots code issues, and provides interactive visualizations tailored to your project requirements. Whether you’re working with bar chart examples, map charts, or complex Sankey diagrams, Ask FusionDev AI acts as an active collaborator, providing real-time assistance, code generation, and troubleshooting support. This level of interaction sets FusionCharts apart and positions it as a frontrunner in AI-powered data visualization.
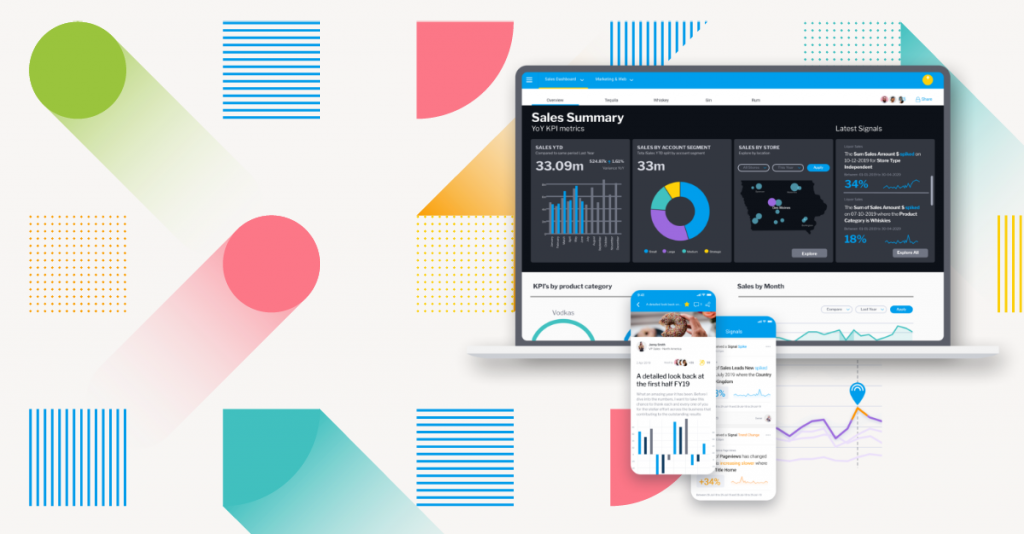 Yellowfin is an AI-powered analytics platform that excels in automated business monitoring, machine learning, and natural language query. Its Signals feature provides proactive alerts, while Assisted Insights offers automated data analysis and explanations. Guided NLQ simplifies complex data exploration for users of all skill levels. By combining these AI capabilities, Yellowfin empowers businesses to uncover valuable insights and make data-driven decisions effectively.
 Domo’s AI capabilities focus on providing actionable insights from data. The platform offers predictive analytics, anomaly detection, and automated data preparation. While strong in business intelligence and data management, Domo’s visualization options might be less extensive compared to specialized data visualization tools.
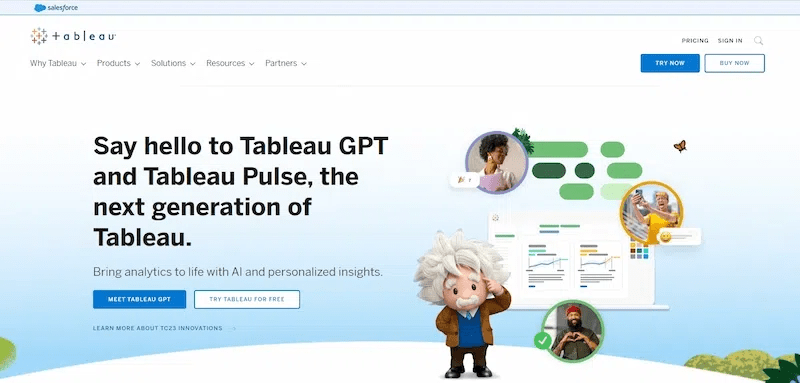 Tableau has integrated AI features to enhance its data discovery capabilities. The platform offers automated insights, predictive analytics, and natural language search. While not as advanced as some dedicated AI-focused tools, Tableau’s strength lies in its robust data connectivity, customization options, and large user community.
 ThoughtSpot is renowned for its natural language search capabilities, allowing users to explore data using everyday language. Its AI-driven insights provide valuable recommendations and uncover hidden patterns. While strong in exploratory data analysis, ThoughtSpot’s visualization options might be less extensive compared to other platforms.
 Infogram has positioned itself as a leader in interactive data storytelling. Its AI for data visualization capabilities focus on automating chart selection, providing design recommendations, and even generating basic data narratives. The platform’s strength lies in its user-friendly interface and extensive library of customizable templates. However, its AI features, while promising, are still relatively basic compared to some competitors./p>
Table of Contents
The Struggles with Traditional Documentation
Traditional documentation methods can be time-consuming, error-prone, and quickly outdated. This hampers productivity, especially when dealing with complex data charts like Pareto charts, heat maps, or Sankey diagrams. AI for data visualization is reshaping the software documentation landscape, transforming it from a static, error-prone resource into a dynamic, proactive tool. Traditional methods are often time-consuming and outdated, while AI-powered solutions offer automation, enhanced searchability, and personalized help resources delivery. AI enhances searchability and accessibility, delivering highly relevant information instantly by understanding the context of code snippets and user queries. This eliminates the frustration of sifting through lengthy manuals. Additionally, AI generates interactive tutorials and guides, tailoring learning experiences to individual needs by analyzing user behavior and preferences.NLP Solutions to the Rescue: How AI for Data Visualization can Transform Documentation
AI for data visualization can revolutionize documentation by tailoring it to individual user needs. Imagine a documentation system that understands your specific context and delivers information precisely when you need it.Contextual Search and Intelligent Recommendations
AI empowers developers with intelligent search capabilities that go beyond simple keyword matching. By understanding the context of user queries and code, AI delivers precise and relevant results, accelerating problem-solving and decision-making.Code Suggestions and Guidance
To streamline development, AI provides context-aware code suggestions and examples. By understanding the project context and user intent, these tools offer relevant code snippets, reducing development time and minimizing errors.Interactive Learning Experiences
Interactive tutorials can be transformed into dynamic learning experiences through AI. By tracking user actions and progress, the system can adapt the tutorial content to the user’s skill level and learning pace. For example, if a user is struggling with a particular concept, the AI can provide additional explanations or examples.Self-Updating Documentation
Keeping documentation up-to-date is a constant challenge. AI can automate this process by continuously monitoring code changes and updating the documentation accordingly. This ensures that users always have access to the latest information.24/7 Support
Imagine having an expert data visualization companion available around the clock. Ask FusionDev AI is your tireless assistant. They provide instant suggestions and solutions for all types of tasks including simple and complex tasks. This ensures you always get started on time in your development process. By combining these features, AI-powered documentation can create a personalized and efficient experience for users, significantly improving their ability to understand and utilize software effectively.Revolution of AI for Data Visualization
AI-powered documentation significantly boosts productivity for data professionals by automating routine tasks and providing intelligent support. Tasks such as searching for specific information, understanding complex code, or troubleshooting issues become faster and more efficient, allowing data analysts and scientists to focus on higher-value activities like data exploration, modeling, and visualization.Increased Productivity for Data Visualization and Analytics Professionals
By using ai for data visualization for routine tasks and providing intelligent support, AI-powered documentation significantly boosts productivity for data professionals. Tasks such as searching for specific information, understanding complex code, or troubleshooting issues become significantly faster and more efficient. This allows data analysts and scientists to focus on higher-value activities, such as data exploration, modeling, and visualization.Reduced Time Spent Searching for and Interpreting Documentation
One of the most time-consuming aspects of working with complex tools is searching for the right information. AI-powered documentation eliminates the need for extensive manual searches by providing relevant information instantly. By understanding user intent and context, AI can deliver precise answers, saving valuable time and reducing frustration.Improved Accuracy and Consistency of Information
Traditional documentation often suffers from inconsistencies and errors. AI-powered documentation can help maintain accuracy and consistency by automatically updating information based on code changes and providing standardized templates for content creation. This ensures that all users are working with the same information, reducing the risk of misunderstandings and errors.Lowered Learning Curve for New Users and Beginners
Onboarding new team members can be a time-consuming process. AI-powered documentation can accelerate the learning curve by providing tailored guidance and support. Interactive tutorials and personalized recommendations can help new users quickly become proficient in using tools and understanding complex concepts.Enhanced User Experience and Satisfaction
Ultimately, the goal of documentation is to /the user experience. With, AI for data visualization tools documentation achieves this by providing a seamless and intuitive interface. By anticipating user needs and delivering information clearly and concisely, AI can significantly enhance user satisfaction and productivity.A Showdown of AI-Powered Data Visualization Tools
FusionCharts: AI for Enhanced Data Visualization
FusionCharts has introduced Ask FusionDev AI, an intelligent assistant that not only fetches API references but also suggests relevant chart examples, troubleshoots code issues, and provides interactive visualizations tailored to your project requirements. Whether you’re working with bar chart examples, map charts, or complex Sankey diagrams, Ask FusionDev AI acts as an active collaborator, providing real-time assistance, code generation, and troubleshooting support. This level of interaction sets FusionCharts apart and positions it as a frontrunner in AI-powered data visualization.
Yellowfin BI: AI-Powered Data Analytics
Yellowfin is an AI-powered analytics platform that excels in automated business monitoring, machine learning, and natural language query. Its Signals feature provides proactive alerts, while Assisted Insights offers automated data analysis and explanations. Guided NLQ simplifies complex data exploration for users of all skill levels. By combining these AI capabilities, Yellowfin empowers businesses to uncover valuable insights and make data-driven decisions effectively.
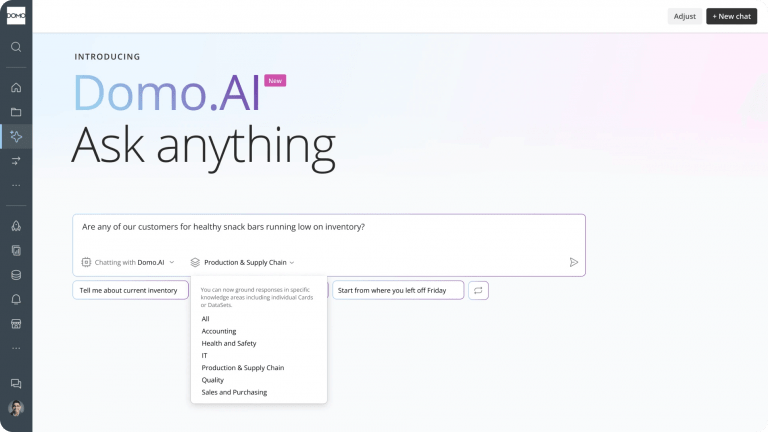
Domo: AI-Driven Actionable Insights
Domo’s AI capabilities focus on providing actionable insights from data. The platform offers predictive analytics, anomaly detection, and automated data preparation. While strong in business intelligence and data management, Domo’s visualization options might be less extensive compared to specialized data visualization tools.
Tableau: AI-Augmented Data Discovery
Tableau has integrated AI features to enhance its data discovery capabilities. The platform offers automated insights, predictive analytics, and natural language search. While not as advanced as some dedicated AI-focused tools, Tableau’s strength lies in its robust data connectivity, customization options, and large user community.
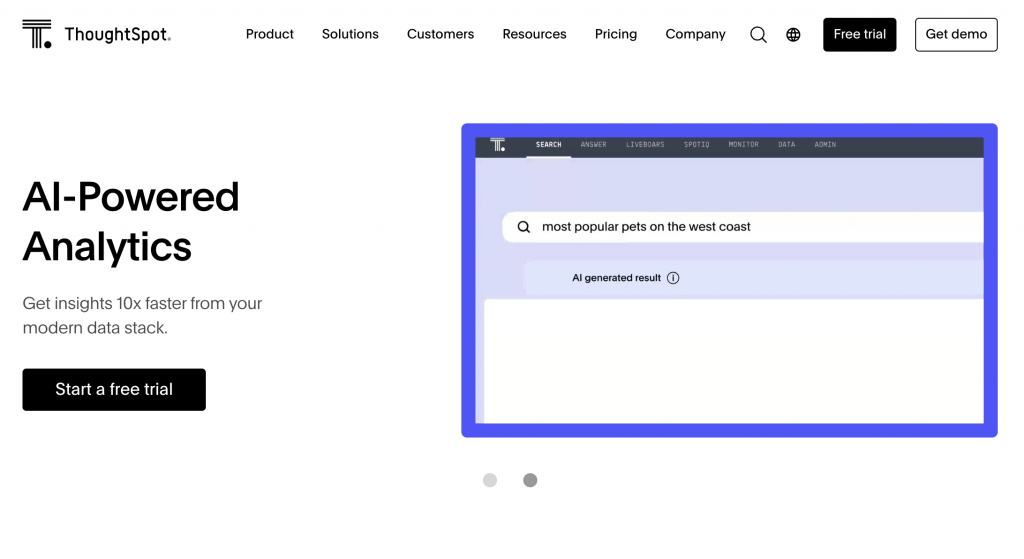
ThoughtSpot: Natural Language Search and AI-Driven Insights
ThoughtSpot is renowned for its natural language search capabilities, allowing users to explore data using everyday language. Its AI-driven insights provide valuable recommendations and uncover hidden patterns. While strong in exploratory data analysis, ThoughtSpot’s visualization options might be less extensive compared to other platforms.
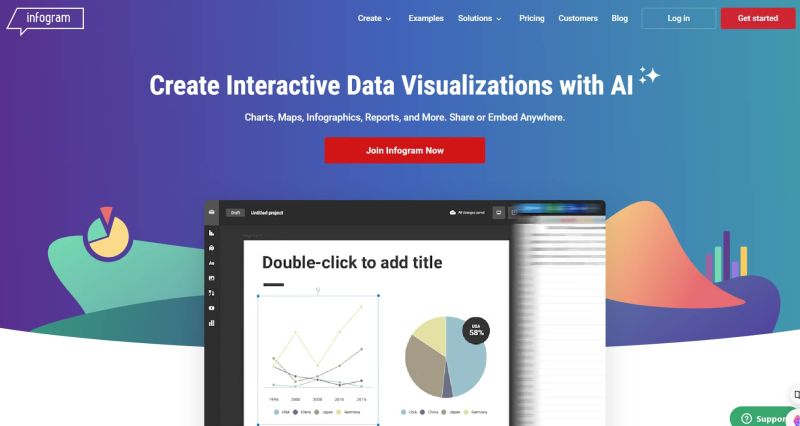
Infogram: Interactive Storytelling with AI
Infogram has positioned itself as a leader in interactive data storytelling. Its AI for data visualization capabilities focus on automating chart selection, providing design recommendations, and even generating basic data narratives. The platform’s strength lies in its user-friendly interface and extensive library of customizable templates. However, its AI features, while promising, are still relatively basic compared to some competitors./p>