Categories: Tutorials

Analytic Dashboard using Drupal and FusionCharts

Drupal is a content management software with a lot of useful and powerful features, like easy content authoring, reliable performance, and excellent security. The flexibility and modularity of Drupal is what gives the extra edge as a content management software. Its tools help us to build the versatile, structured content that dynamic web experiences need. It is designed to be the perfect content management solution for admins and moderators, who needs both simplicity and flexibility. It accomplishes this through its modular approach to site building. For more details about drupal, click here. In this article, you will see how to use FusionCharts in combination with Drupal to create an interactive analytic dashboard. Let’s now move on to how you can create the perfect dashboard using FusionCharts and Drupal. Following are some of the use cases for different kinds of users:
  • Admins: To analyze traffic on website, and how the content is working
  • Moderators: To see how their content is working, views on pages, articles, etc
To get the code in this blog working, we need to install the following components:
  • Xampp: We are going to use the XAMPP server for this tutorial. You can use any other server that supports PHP and its frameworks like the MAMP server, the AMPPS server, etc. You can download XAMPP from here; it is available across all major platforms including Windows, OS X, and Linux.
  • FusionCharts: You can download the latest version of FusionCharts Suite XT from here. Alternately, you can also install it using the npm or bower package managers, using the commands given below:
    1. For npm:
      npm install fusioncharts
      npm install fusionmaps
    2. For Bower:
      bower install fusioncharts
      bower install fusionmaps
  • Drupal: Download drupal and keep the extracted file in xampp/htdocs folder as shown in the image below: Inside the drupal folder, go through the path drupal\sites\default and duplicate the default.settings.php file and rename that duplicate file as settings.php. Once done, create a new folder called files and keep that inside the default folder.
Now install the drupal using localhost. Eg. https://localhost/drupal/ Install drupal by connecting the database. For detailed installation process click here. After installing drupal, login to the site. Once you login successfully the drupal Welcome page will appear as shown below: Click Structure in the admin bar, which provides several options as shown in the image below: Click on Blocks The Add block option appears. Click Add block to create the block for your dashboard. *Fill the required fields, i.e. Block title and Block description. After filling up the details, check the Block body which contains the code for the chart. P.S- We have used FusionCharts Suite XT, PHP, and MySQL to create the dynamic charts for the dashboard. Keep the data table required for the dashboard inside the database, to connect drupal at the time of installation. The first part of the php code, helps you to connect with the database required for the dashboard.
connect_error) {
     exit("There was an error with your connection: ".$dbhandle->connect_error);
   }
?>
Extract files from the downloaded FusionCharts Suite XT and keep the fusioncharts.js and fusioncharts.charts.js file inside a folder and keep that folder inside the directory called modules inside the drupal folder. e.g. C:\xampp\htdocs\drupal\modules\lib Similarly, keep the fusioncharts.theme.fint.js inside the directory called themes inside the drupal folder. In the second part of PHP code, include the paths of library files fusioncharts.js, fusioncharts.charts.js and fusioncharts.theme.fint.js using the drupal_add_js() function as shown below(Include these files inside any one block, the entire page will be able to use these script files, i.e. no need to add these files inside every block.).
 drupal_add_js('modules/lib/fusioncharts.js');
drupal_add_js('modules/lib/fusioncharts.charts.js');
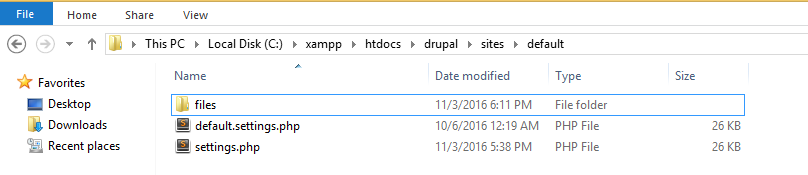
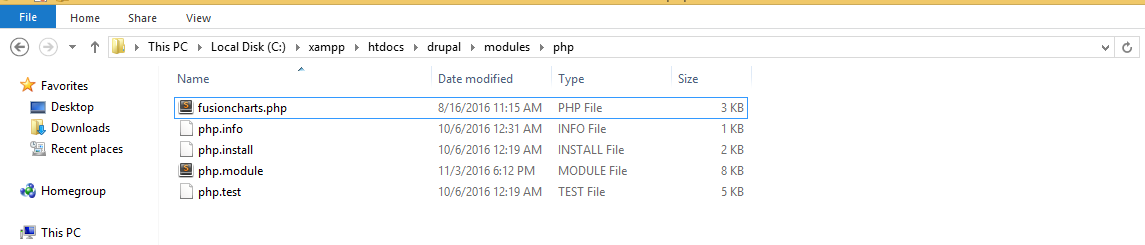
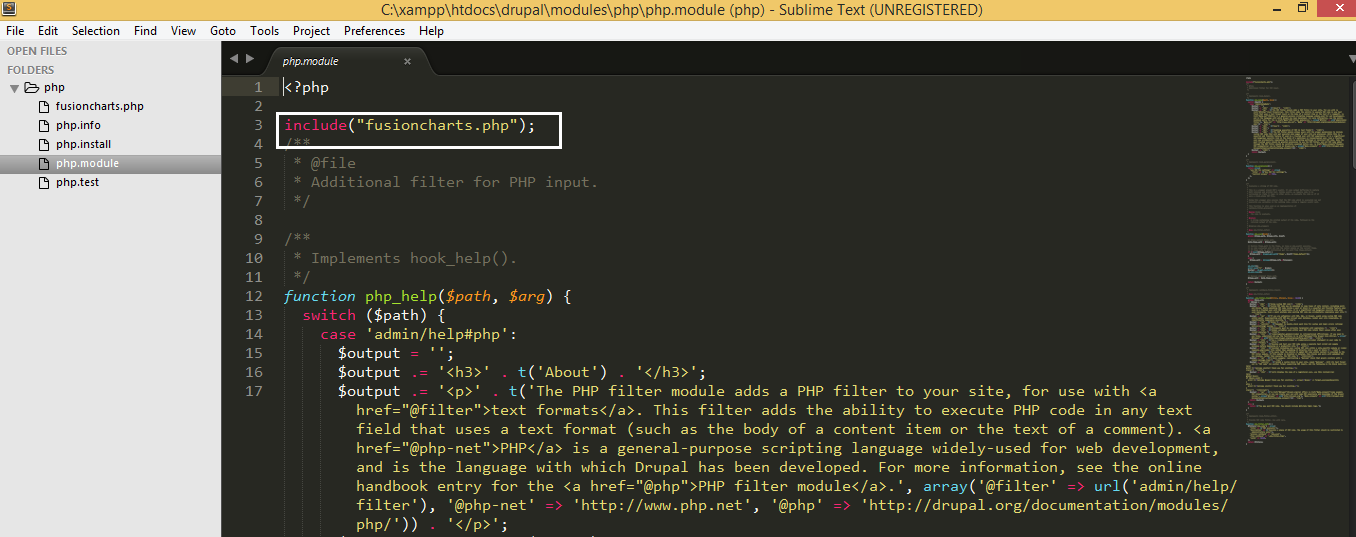
drupal_add_js('themes/fusioncharts.theme.fint.js');
Download the fusioncharts php wrapper and keep the fusioncharts.php file inside modules/php folder. Include the fusioncharts.php inside the php.module code. Once the FusionCharts php wrapper is included let’s get back to the code. Inside php tag, using sql query, fetch the data from the database.
$strQuery = "SELECT DISTINCT revenue_type, revenue_value,revenue_budget, expenditure_type, expenditure_value,expenditure_budget FROM financial_records";
 $result = $dbhandle->query($strQuery) or exit("Error code ({$dbhandle->errno}): {$dbhandle->error}");
Achieve the required json format using php,to render the chart.
 if ($result) {
     //Creating the chart object
     $arrData1 = array(
        "chart" => array(
                    "paletteColors" => "#23B7B7,#ED3132,#3CDAE0",
                    "bgColor" => "#EAEAEA",
                    "showLabels"=>"0",
                    "showBorder" => "0",
                    "use3DLighting" => "0",
                    "showShadow" => "0",
                    "enableSmartLabels" => "0",
                    "startingAngle" => "0",
                    "showPercentValues" => "1",
                    "showPercentInTooltip" => "0",
                    "decimals" => "1",
                    "captionFontSize" => "14",
                    "subcaptionFontSize" => "14",
                    "subcaptionFontBold" => "0",
                    "toolTipColor" => "#ffffff",
                    "toolTipBorderThickness" => "0",
                    "toolTipBgColor" => "#000000",
                    "toolTipBgAlpha" => "80",
                    "toolTipBorderRadius" => "2",
                    "toolTipPadding" => "5",
                    "showHoverEffect" => "1",
                    "showLegend" => "1",
                    "legendBgColor" => "#ffffff",
                    "legendBorderAlpha" => "0",
                    "legendShadow" => "0",
                    "legendItemFontSize" => "10",
                    "legendItemFontColor" => "#666666",
                    "useDataPlotColorForLabels" => "1",
                    "theme"=>"fint"
               )
          );

    //creating the data array
        $arrData1["data"]=array();
          while($row = mysqli_fetch_array($result)) {
                            
                    array_push($arrData1["data"], array(

                          "label" => $row["expenditure_type"],
                          "value"=>$row["expenditure_value"]
                         )
                    );      
          }

    //encoding the array in json format
      $jsonEncodedData_chart1 = json_encode($arrData1);
     
$expenditureChart = new FusionCharts("pie2d", "chart2" , "100%", "300", "chart-container2", "json", $jsonEncodedData_chart1);

//rendering the chart
      $expenditureChart->render();

      // closing db connection
      $dbhandle->close();
   }
?>
Finally define the div where the chart will render. i.e.
Chart will render here!
Keep this code inside Block body. Select the text format as php code. [ If this option doesn’t appear click on Modules. Scroll down to the PHP filter module and check the Enabled box. Press the Save Configuration button Now, again scroll down to the PHP filter module where two links have been added. The first is help. It’s not long and is worth reading, so check it out. The second link is permissions. Click on this to go to the Permissions page. Scroll down to the Filter section. There is a new item called Use the PHP code text format and its checkbox for the Administrator is not checked. The permission box must be checked for the role that needs to use PHP code in order for the PHP filter to show on input boxes. Finally click on Save permissions. Inside the REGION SETTINGS, specify in which themes and regions this block is going to be displayed. Once done save the block. Similarly construct other blocks and render the chart inside the block body, which are required for the dashboard. Here is the snapshot of the final; dashboard. Perfect isn’t it? If you see any errors in your code, click here to download the complete source code of the dashboard we have created for this tutorial.
Dishank Tiwari and Prerana Singh

Recent Posts

What is a Bar Chart Used For?

Imagine you’re comparing the sales performance of your top product lines across different regions, or…

1 month ago

AI-Powered Documentation for Data Visualization & Analytics

Have you ever spent hours buried in documentation, hunting for a specific piece of code?…

2 months ago

Unveiling the Hidden Gems: Top 5 AI Data Visualization Tools for 2024

Do you feel like your data is a cryptic puzzle, locked away from revealing its…

3 months ago

Unleash the Power of AI: Smart Charting for JavaScript Developers

In web development, mastering JavaScript charting libraries is crucial for keeping up with the fast-paced…

3 months ago

Focus on the Magic, Not the Mundane: Ask FusionDev AI is Here!

Ever spend an afternoon neck-deep in documentation, searching for that one elusive code snippet? Or…

3 months ago

FusionCharts 4.0: New Data Visualization Capabilities

In the dynamic world of data visualization, the need for precision and innovation has never…

4 months ago