Table of Contents
npm install -g ionic cordova You can also refer to the documentation page of Ionic 2 from here.ionic start fusiondatabase blank The above command will install all the dependencies to run a basic project.ionic cordova plugin add cordova-sqlite-storage Note: To know more, refer to the documentation of SQLite plugin.import { SQLite } from '@ionic-native/sqlite';providers: [SQLite,
StatusBar,
SplashScreen,
{provide: ErrorHandler, useClass: IonicErrorHandler}
]
import { SQLite, SQLiteObject } from '@ionic-native/sqlite';constructor(public navCtrl: NavController,private sqlite: SQLite) {
}
npm install angular2-fusioncharts --save app.module.ts looks like: import { BrowserModule } from '@angular/platform-browser';
import { ErrorHandler, NgModule } from '@angular/core';
import { IonicApp, IonicErrorHandler, IonicModule } from 'ionic-angular';
import { SplashScreen } from '@ionic-native/splash-screen';
import { StatusBar } from '@ionic-native/status-bar';
import { SQLite } from '@ionic-native/sqlite';
import { MyApp } from './app.component';
import { HomePage } from '../pages/home/home';
// Import angular2-fusioncharts
import { FusionChartsModule } from 'angular2-fusioncharts';
// Import FusionCharts library
import * as FusionCharts from 'fusioncharts';
// Load FusionCharts Charts module
import Charts from "fusioncharts/fusioncharts.charts";
// Load themes
import themes from "fusioncharts/themes/fusioncharts.theme.fint";
@NgModule({
declarations: [
MyApp,
HomePage
],
imports: [
BrowserModule,
FusionChartsModule.forRoot(FusionCharts, Charts, themes),
IonicModule.forRoot(MyApp)
],
bootstrap: [IonicApp],
entryComponents: [
MyApp,
HomePage
],
providers: [SQLite,
    StatusBar,
    SplashScreen,
    {provide: ErrorHandler, useClass: IonicErrorHandler}
  ]
})
export class AppModule {}
With this, you have set the environment by installing and configuring all the applications required.home.ts file, copy the code below: store=[];
label='';
value='';
items1 = [];
items2 = [];
draw()
{
this.sqlite.create({
name: 'data.db',
location: 'default'
})
.then((db: SQLiteObject) => {
//database create section
db.executeSql('CREATE TABLE IF NOT EXISTS singleseries(id INTEGER PRIMARY KEY AUTOINCREMENT,label,value)', {})
.then(() => console.log('Executed SQL'))
.catch(e => console.log(e));
//data insert section
db.executeSql('INSERT INTO singleseries VALUES(?)', [this.label,this.value])
.then(() => console.log('Executed SQL'))
.catch(e => console.log(e));
this.store=[];
this.items1 = [];
this.items2 =[];
this.items1.push({label: 'Java'});
this.items2.push({value: '36435'});
this.items1.push({label: 'JavaScript'});
this.items2.push({value: '28855'});
this.items1.push({label: 'PHP'});
this.items2.push({value: '24358'});
this.items1.push({label: 'SQL'});
this.items2.push({value: '18072'});
this.items1.push({label: 'C#'});
this.items2.push({value: '11648'});
this.items1.push({label: 'C++'});
this.items2.push({value: '8455'});
this.items1.push({label: 'Python'});
this.items2.push({value: '7760'});
this.items1.push({label: 'C'});
this.items2.push({value: '7359'});
this.items1.push({label: 'Shell'});
this.items2.push({value: '7359'});
for(var i = 0; i < this.items1.length; i++) {
var dataset={
label :this.items1[i].label,
value :this.items2[i].value
}
this.store.push(dataset);
}
}
this.dataSource = {
"chart": {
"caption": "Widely used Programming languages",
"paletteColors": "#FFFFFF",
"bgColor": "#141B28",
"bgAlpha": "70",
"showBorder": "0",
"showCanvasBorder": "0",
"canvasbgcolor": "#141B28",
"canvasBgAlpha": "0",
"baseFontColor": "#ffffff",
"usePlotGradientColor": "0",
"plotBorderAlpha": "10",
"placeValuesInside": "0",
"plotspacepercent": "40",
"outCnvBaseFontsize": "15",
"axisLineAlpha": "25",
"yaxismaxvalue": "45000",
"formatnumberscale": "1",
"showxaxisline": "1",
"xaxislinecolor": "#ffffff",
"toolTipColor": "#ffffff",
"toolTipBorderThickness": "0",
"toolTipBgColor": "#000000",
"toolTipBgAlpha": "80",
"toolTipBorderRadius": "2",
"toolTipPadding": "5"
},
"data": this.store
}
this.visible = true;
}, (err) => {
alert('Unable to execute sql: '+JSON.stringify(err));
});
})
.catch(e => console.log(JSON.stringify(e)));
}
By following the steps mentioned above, you are ready with your home.ts file with all the required code: import { Component } from '@angular/core';
import { NavController } from 'ionic-angular';
import { SQLite, SQLiteObject } from '@ionic-native/sqlite';
@Component({
selector: 'page-home',
templateUrl: 'home.html'
})
export class HomePage {
dataSource: Object;
visible: boolean = false;
constructor(public navCtrl: NavController,private sqlite: SQLite) {

  }
store=[];
label='';
value='';
items1 = [];
items2 = [];
draw()
{
this.sqlite.create({
name: 'data.db',
location: 'default'
})
.then((db: SQLiteObject) => {
//database create section
db.executeSql('CREATE TABLE IF NOT EXISTS singleseries(id INTEGER PRIMARY KEY AUTOINCREMENT,label,value)', {})
.then(() => console.log('Executed SQL'))
.catch(e => console.log(e));
//data insert section
db.executeSql('INSERT INTO singleseries VALUES(?)', [this.label,this.value])
.then(() => console.log('Executed SQL'))
.catch(e => console.log(e));
//data retrieve section
db.executeSql('select * from singleseries', {}).then((data) => {
this.store=[];
this.items1 = [];
this.items2 =[];
this.items1.push({label: 'Java'});
this.items2.push({value: '36435'});
this.items1.push({label: 'JavaScript'});
this.items2.push({value: '28855'});
this.items1.push({label: 'PHP'});
this.items2.push({value: '24358'});
this.items1.push({label: 'SQL'});
this.items2.push({value: '18072'});
this.items1.push({label: 'C#'});
this.items2.push({value: '11648'});
this.items1.push({label: 'C++'});
this.items2.push({value: '8455'});
this.items1.push({label: 'Python'});
this.items2.push({value: '7760'});
this.items1.push({label: 'C'});
this.items2.push({value: '7359'});
this.items1.push({label: 'Shell'});
this.items2.push({value: '7359'});
for(var i = 0; i < this.items1.length; i++) {
var dataset={
label :this.items1[i].label,
value :this.items2[i].value
}
this.store.push(dataset);
}
this.dataSource = {
      "chart": {
        "caption": "Widely used Programming languages",
          "paletteColors": "#FFFFFF",
          "bgColor": "#141B28",
          "bgAlpha": "70",
          "showBorder": "0",
          "showCanvasBorder": "0",
          "canvasbgcolor": "#141B28",
          "canvasBgAlpha": "0",
          "baseFontColor": "#ffffff",
          "usePlotGradientColor": "0",
          "plotBorderAlpha": "10",
          "placeValuesInside": "0",
          "plotspacepercent": "40",
          "outCnvBaseFontsize": "15",
          "axisLineAlpha": "25",
          "yaxismaxvalue": "45000",
          "formatnumberscale": "1",
          "showxaxisline": "1",
          "xaxislinecolor": "#ffffff",
          "toolTipColor": "#ffffff",
          "toolTipBorderThickness": "0",
          "toolTipBgColor": "#000000",
          "toolTipBgAlpha": "80",
          "toolTipBorderRadius": "2",
          "toolTipPadding": "5"
      },
      "data": this.store
    }

this.visible = true;

}, (err) => {
alert('Unable to execute sql: '+JSON.stringify(err));
});
})
.catch(e => console.log(JSON.stringify(e)));
}
}
home.html file located in home folder under src folder. [Reference path: src → home→ home.html] Refer to the following code which will already be present in home.html file: <ion-content padding>
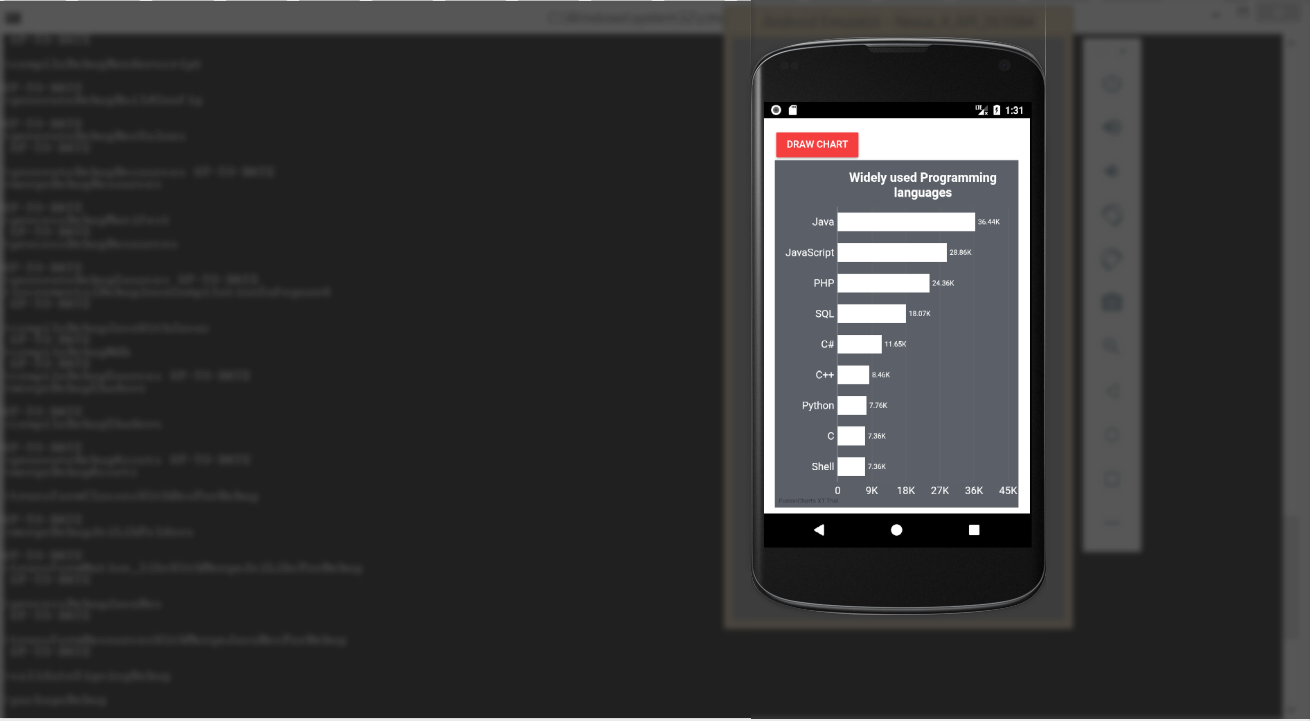
<button ion-button color="danger" (click)="draw()" > Draw Chart </button>
<fusioncharts
*ngIf="visible"
width="100%"
height="500"
type="Bar2D"
dataFormat="JSON"
[dataSource]="dataSource">
</fusioncharts>
</ion-content>
ionic cordova build android This command builds all the files for your application automatically. Note: Please make sure you have cordova plugin installed in your system ionic cordova android run Running the above command will open your emulator and deploy the application. The output looks like: At FusionCharts, we believe in empowering developers and businesses with cutting-edge data visualization tools that…
Ever had a data set that seemed more complicated than a Rubik's cube? You’re not…
We’ve all seen them in textbooks or presentations—those overlapping circles that simplify complex information into…
We’re excited to announce the upcoming release of FusionCharts v4.1—a groundbreaking step forward in the…
Have you ever been overwhelmed by a massive data set and wondered, "How do I…
If you’ve ever tried to make sense of the stock market, you’ve probably come across…