Table of Contents
myproject directory in the current directory. django-admin startproject myproject You can use the cd command within the command-line interface to easily navigate to the required directory. myproject directory.static.index.html, in the template folder. This file will have the path to each javascript file and also the output element. <!DOCTYPE html>
<html>
<head>
<title>FC-python wrapper</title>
{% load static %}
<script type="text/javascript" src="{% static "fusioncharts/fusioncharts.js" %}"></script>
<script type="text/javascript" src="{% static "fusioncharts/themes/fusioncharts.theme.fint.js" %}"></script>
</head>
<body>
<div id="chart-1">{{ output|safe }}</div>
</body>
</html>
python manage.py collectstaticsettings.py file, update the location of the templates 'DIRS': ['fc_column2d/templates'],view.py file.from django.shortcuts import render
from django.http import HttpResponse
# Include the `fusioncharts.py` file which has required functions to embed the charts in html page
from .fusioncharts import FusionCharts
# Loading Data from a Static JSON String
# It is a example to show a Column 2D chart where data is passed as JSON string format.
# The `chart` method is defined to load chart data from an JSON string.
def chart(request):
# Create an object for the column2d chart using the FusionCharts class constructor
column2d = FusionCharts("column2d", "ex1" , "684", "476", "chart-1", "json",
# The data is passed as a string in the `dataSource` as parameter.
"""{
"chart": {
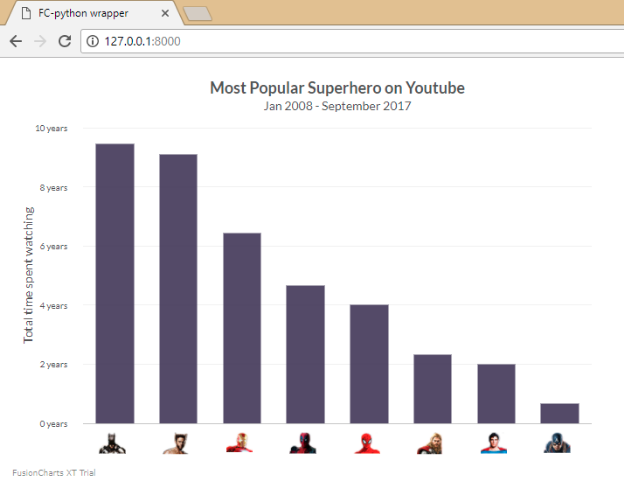
"caption": "Most Popular Superhero on Youtube",
"baseFont": "Lato",
"captionfontsize":"18",
"subcaptionfontbold":"0",
"subcaptionfontsize":"14",
"subcaption": "Jan 2008 - September 2017",
"yaxisname": "Total time spent watching",
"captionpadding": "20",
"bgalpha": "0",
"canvasbgalpha": "0",
"showvalues": "0",
"showborder": "0",
"canvasborderalpha": "0",
"showalternatehgridcolor": "0",
"plotgradientcolor": "",
"showplotborder": "0",
"adjustDiv":"0",
"yaxisnamefontsize":"14",
"yAxisNameFontBold":"0",
"yAxisValuesPadding":"18",
"divlinealpha": "10",
"xaxislinealpha":"20",
"LabelPadding": "50",
"showlabels": "0",
"numdivlines":"4",
"showxaxisline":"1",
"plotspacepercent":"40",
"yAxisValueDecimals":"0",
"formatnumberscale": "1",
"numberscalevalue": "24,31,12",
"numberscaleunit": " days, months, years",
"palettecolors": "#3F365A",
"plotToolText": "<div>Superhero : <b>$label</b><br/>Time Spend : <b>$value Hours</b></div>",
"defaultnumberscale": " years",
"plotFillAlpha": "90"
},
"annotations": {
"autoScale": "0",
"scaleImages": "0",
"origW": "400",
"origH": "300",
"groups": [{
"id": "user-images",
"items": [{
"id": "Batman-icon",
"type": "image",
"url": "https://csm.fusioncharts.com/files/assets/img/batman.png",
"x": "$dataset.0.set.0.CenterX - 18",
"y": "$dataset.0.set.0.EndY + 10",
"xScale": "75",
"yScale": "75"
}, {
"id": "Wolverine-icon",
"type": "image",
"url": "https://csm.fusioncharts.com/files/assets/img/wolverine.png",
"x": "$dataset.0.set.1.CenterX - 18",
"y": "$dataset.0.set.1.EndY + 10",
"xScale": "75",
"yScale": "75"
}, {
"id": "IronMan-icon",
"type": "image",
"url": "https://csm.fusioncharts.com/files/assets/img/ironman.png",
"x": "$dataset.0.set.2.CenterX - 18",
"y": "$dataset.0.set.2.EndY + 10",
"xScale": "75",
"yScale": "75"
}, {
"id": "Deadpool-icon",
"type": "image",
"url": "https://csm.fusioncharts.com/files/assets/img/deadpool.png",
"x": "$dataset.0.set.3.CenterX - 18",
"y": "$dataset.0.set.3.EndY + 10",
"xScale": "75",
"yScale": "75"
}, {
"id": "SpiderMan-icon",
"type": "image",
"url": "https://csm.fusioncharts.com/files/assets/img/spiderman.png",
"x": "$dataset.0.set.4.CenterX - 18",
"y": "$dataset.0.set.4.EndY + 10",
"xScale": "75",
"yScale": "75"
}, {
"id": "Thor-icon",
"type": "image",
"url": "https://csm.fusioncharts.com/files/assets/img/thor.png",
"x": "$dataset.0.set.5.CenterX - 18",
"y": "$dataset.0.set.5.EndY + 10",
"xScale": "75",
"yScale": "75"
}, {
"id": "SuperMan-icon",
"type": "image",
"url": "https://csm.fusioncharts.com/files/assets/img/superman.png",
"x": "$dataset.0.set.6.CenterX - 18",
"y": "$dataset.0.set.6.EndY + 10",
"xScale": "75",
"yScale": "75"
}, {
"id": "CaptainAmerica-icon",
"type": "image",
"url": "https://csm.fusioncharts.com/files/assets/img/captain-america.png",
"x": "$dataset.0.set.7.CenterX - 18",
"y": "$dataset.0.set.7.EndY + 10",
"xScale": "75",
"yScale": "75"
}]
}]
},
"data": [{
"label": "Batman",
"value": "85000"
}, {
"label": "Wolverine",
"value": "82000"
}, {
"label": "Iron Man",
"value": "58000"
}, {
"label": "Deadpool",
"value": "42000"
}, {
"label": "Spider Man",
"value": "36000"
}, {
"label": "Thor",
"value": "21000"
}, {
"label": "Super Man",
"value": "18000"
}, {
"label": "Captain A",
"value": "6000"
}]
}""")
# returning complete JavaScript and HTML code, which is used to generate chart in the browsers.
return render(request, 'index.html', {'output' : column2d.render()})
urls.py file, to automatically set the URL to render the chart. from django.conf.urls import url
from.import views
urlpatterns = [
url(r'^$', views.chart, name = 'demo'),
]
STATICFILES_DIRS object, include it in the settings.py file.STATICFILES_DIRS = [
os.path.join(BASE_DIR, "fc_column2d/templates/static"),
]
python manage.py runserverAt FusionCharts, we believe in empowering developers and businesses with cutting-edge data visualization tools that…
Ever had a data set that seemed more complicated than a Rubik's cube? You’re not…
We’ve all seen them in textbooks or presentations—those overlapping circles that simplify complex information into…
We’re excited to announce the upcoming release of FusionCharts v4.1—a groundbreaking step forward in the…
Have you ever been overwhelmed by a massive data set and wondered, "How do I…
If you’ve ever tried to make sense of the stock market, you’ve probably come across…