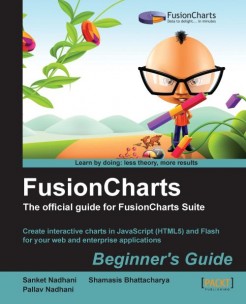
One fine morning we woke up to a tweet from Packt Publications – Consider yourself a pro with FusionCharts 3.2? Why not write a FusionCharts 3.2 Beginner’s Guide for Packt? Somebody wanted a book on the software we created and have been working on for a decade… that was BIG! We were super kicked about it. We thought we will drop in a quick line to the publishers saying we would be happy to review the book and be of help with the book in general. A couple of emails and phone calls with the publisher, we decide that we will write the book ourselves (it’s our software after all) and it would be the official guide to FusionCharts Suite. Here we are, after a year of planning, writing, rewriting, proofreading… all in all a lot of hard work to bring to you “FusionCharts Beginner’s Guide: The Official Guide for FusionCharts Suite”.
 Enough of the history. Tell me about the book.
Overview of the FusionCharts Beginner’s Guide
The FusionCharts Beginner’s Guide is a practical, step-by-step guide to using FusionCharts Suite for creating delightful web reports and dashboards. It gets your first chart up in 15 minutes after which you can play around with different chart types and customize them. You will also learn how to create a powerful reporting experience using drill-down, chart export and advanced JavaScript capabilities. You will also integrate the charts with PHP, ASP.NET, Java and any other server-side script pulling data from databases. Finally you round up the experience learning reporting best practices including right chart type selection and practical usability tips to become the data visualization guru among your friends and colleagues.
This book is both for beginners and advanced web developers who need to create interactive charts for their web applications. It is a fast-paced yet comprehensive guide to FusionCharts Suite filled with examples and practical tips, and no previous knowledge of FusionCharts Suite is assumed.
In case you want a closer look, here go the chapter heads:
Chapter 1: Introducing FusionCharts
Chapter 2: Customizing your Chart
Chapter 3: JavaScript Capabilities
Chapter 4: Enabling Drill-down on Charts
Chapter 5: Exporting Charts
Chapter 6: Integrating with Server-side Scripts
Chapter 7: Creating Maps for your Applications
Chapter 8: Selecting the Right Visualization for your Data
Chapter 9: Increasing the Usability of your Charts
You can take a look at the complete table of contents on the Packt website, and even download the first chapter, ‘Introducing FusionCharts’, for free.
A decade of learning packed into a quick read
A decade back, when FusionCharts was born, there were no interactive charting tools in the market. Boring Excel charts were all you had at your disposal. We then pioneered the very concept of Flash charts to bring great-looking animated and interactive charts to solutions across the world. And a year back, we brought all that awesomeness to JavaScript (HTMl5) as well. We have learnt extensively from customers right from one-man startups to large organizations like the US Army, countries as far away as
New Zealand to Brazil, and domains as varied as manufacturing tools to stock tickers. And now we are bringing all that learning to you.
Written by Sanket Nadhani who previously headed Marketing & Sales at FusionCharts and wrote extensively about charting best practices on the FusionCharts blog, Shamasis Bhattacharya who is our JavaScript architect and loves everything web, and myself (well, I founded FusionCharts and currently serve as the CEO ), this book packs all our learning into one quick and easy read.
Final words
The book was a big project for us and we quite like the way it has come out. But then there is only so much boasting we can do on our own. We would love to know what you think of the book, either here in the comments or in the reviews at Amazon, or Packt’s website. Happy learning!


