The importance of data visualization tools increases with the availability of massive amounts of data. Managers and executives need powerful, interactive, data visualizations to keep up with current trends and make informed decisions for the future of their organizations.
While there are many charting and plotting tools out there, which provide interactivity? Also, how much time should you be spending on developing an interactive graph? Read on to find out the importance of interactive graphs, their various features, and why building an interactive graph with FusionCharts is so quick.
Table of Contents
What is an Interactive Graph?
An interactive graph is responsive to different types of user actions — static charts aren’t. An interactive graph allows users to pan, scale and zoom. Depending upon the end application, they also provide different data views, magnify certain parts, or show the entire dataset at a glance.
Why do you Need an Interactive Graph?
While there are many tools for charting and graphing data, most of them just create static illustrations. Viewing them is the same as viewing a picture. Data, a live entity, deserves an interactive view. Your users should be able to either focus on different parts of your data or all your data points at once. In a nutshell, interactive graphs engage users and provide an immersive experience.
What are the features of FusionCharts Interactive Graphs?
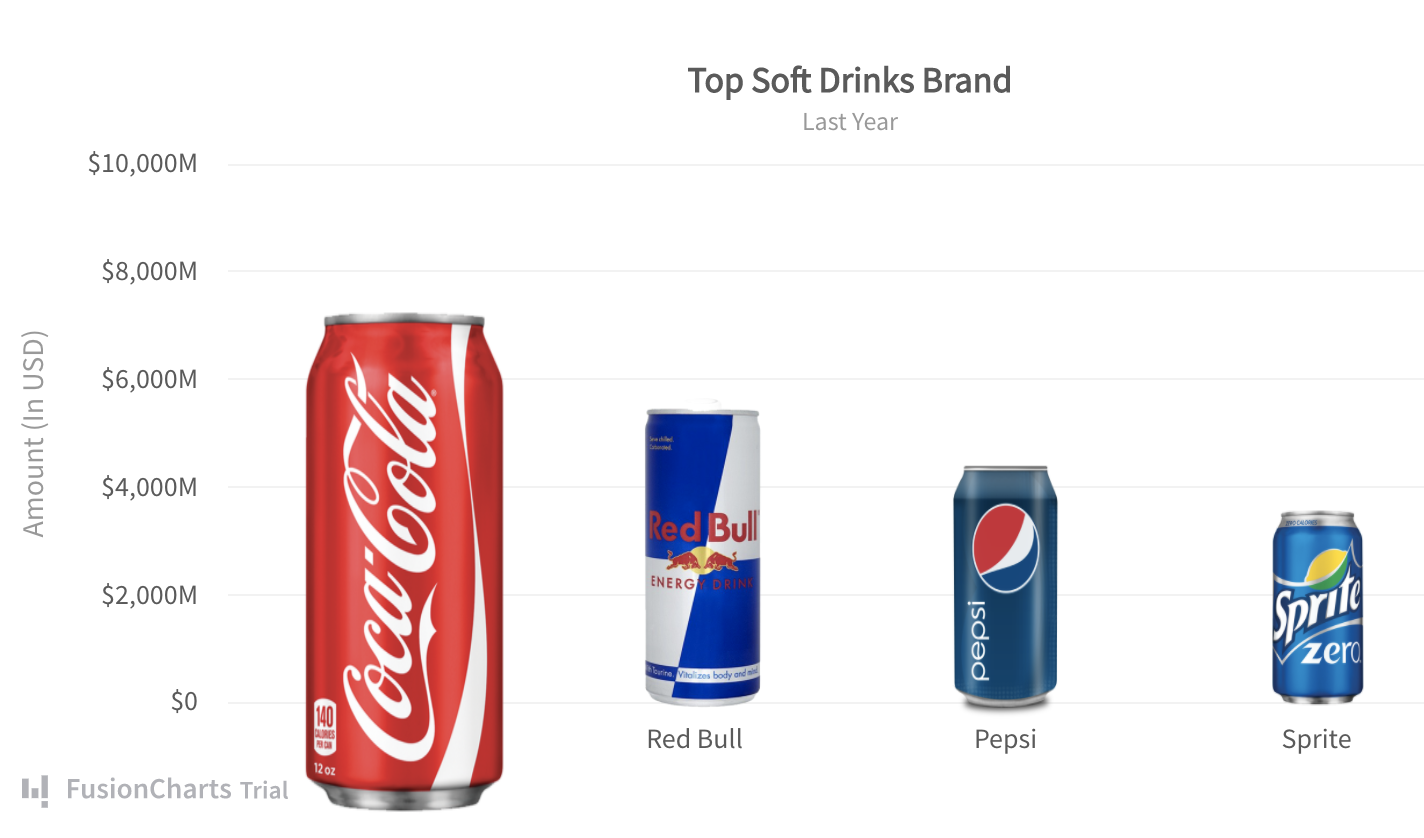
Graphs and charts created with FusionCharts are dynamic and interactive. Some great features include Interactive Legends, Tool Tips, Zooming, Scrolling and Panning, and Customized Chart Loading as well as Mouse, Keyboard, and Other Events :
What are Interactive Legends?
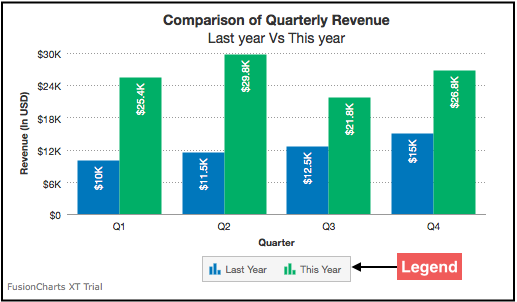 All FusionCharts legends are interactive by default. Interactive legends can highlight, hide or slice in / slice out data points in a graph. In addition, clicking on a data series in the legend results in highlighting that data series, allowing the user to focus on this part of the data.
Your user can also hide or display legends in a chart or graph with a simple mouse click. For example, expert users familiar with your graph details can choose to hide them and novice users can turn them on.
All FusionCharts legends are interactive by default. Interactive legends can highlight, hide or slice in / slice out data points in a graph. In addition, clicking on a data series in the legend results in highlighting that data series, allowing the user to focus on this part of the data.
Your user can also hide or display legends in a chart or graph with a simple mouse click. For example, expert users familiar with your graph details can choose to hide them and novice users can turn them on.
Are there ToolTips?
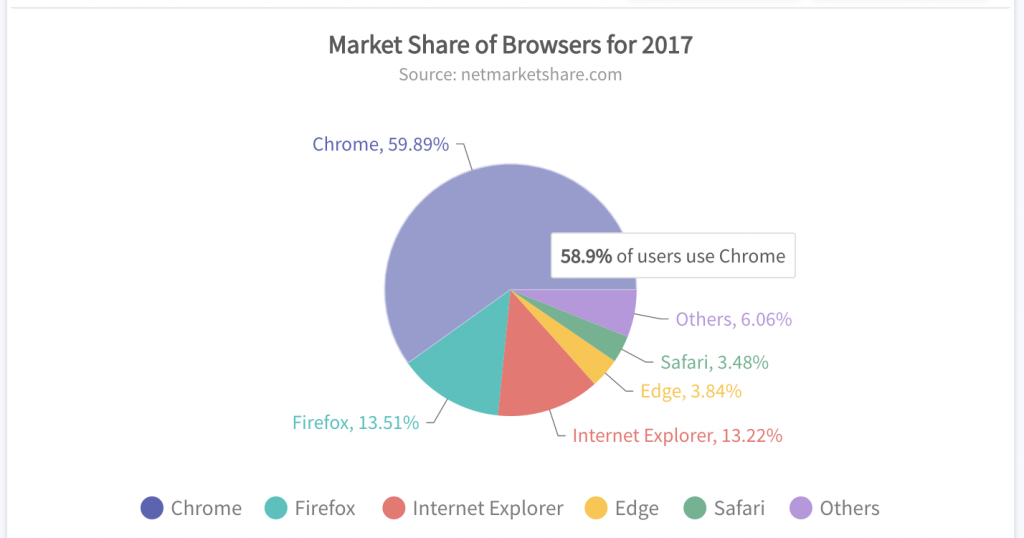 Tooltips also bring interactivity into your graph or chart. They display all types of details related to your data points. FusionCharts enables Tooltips by default. They are also100% customizable.
What about Zooming, Scrolling, and Panning?
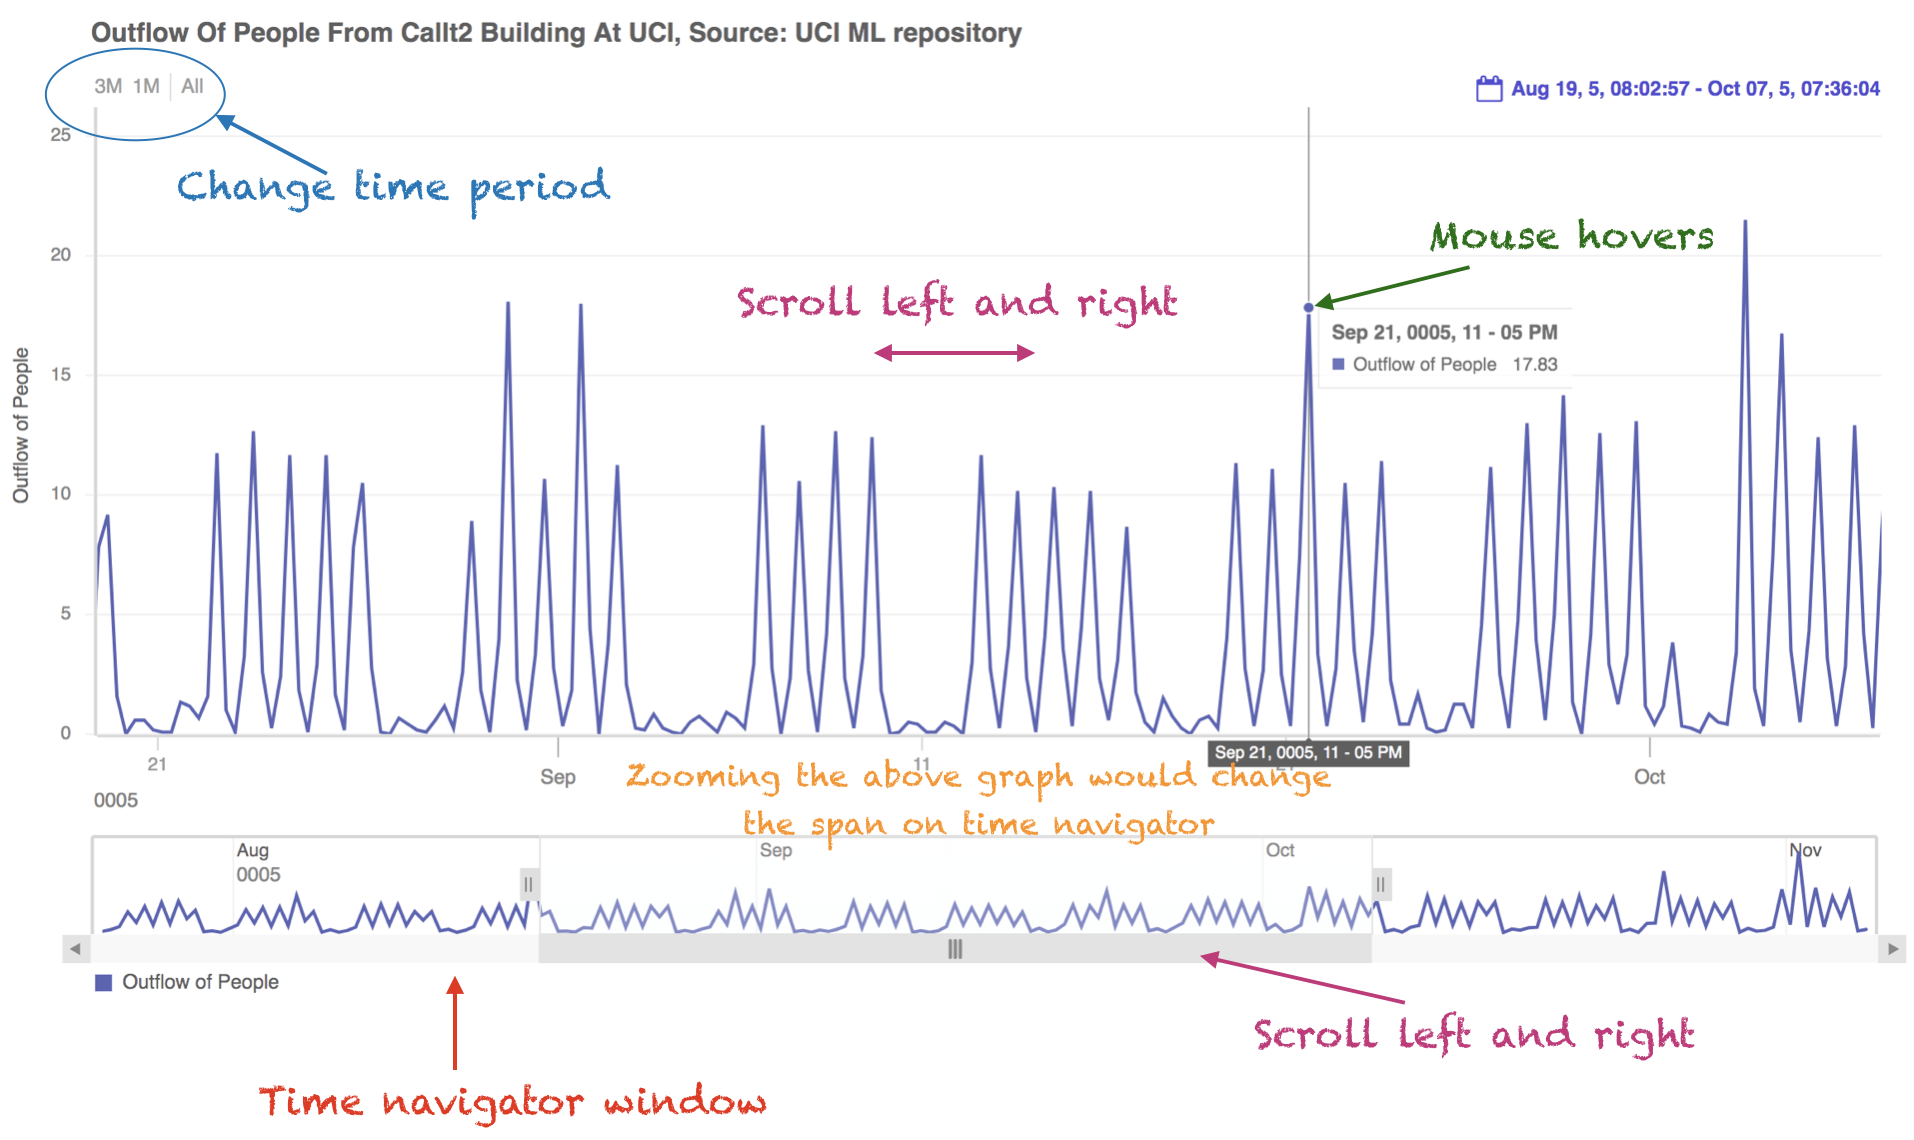 Another great FusionCharts feature is the ability to zoom, pan, and scale. This is another default behavior that lets your users study fine details in a graph, focus on a specialized area, or look at your data in its entirety.
Can Chart Loading be Customized?
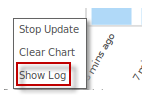 In FusionCharts, you can define messages and customized behaviors when you load charts or graphs. You can also notify your users about events such as data loading problems, data mismatches, or unusual data events.
What are Chart Annotations?
 In FusionCharts, you can define and display customized images or shapes in charts and graphs. You can also configure events related to these annotations. For example, you can display detailed information when a user hovers their mouse over data series or data points.
What About Mouse, Keyboard, and Other Events?
FusionCharts allows users to capture all kinds of mouse and keyboard events. You can change the default behavior of events by defining handlers for them. This means your developers can write their own handlers for mouse, keyboard, data loading, and data updating to make a graph more interactive and responsive.Why is Building an Interactive Graph with FusionCharts Blazing Fast?
FusionCharts is the best platform for building interactive and responsive graphs, charts, and maps. While there are other data visualization tools out there, they offer static interfaces. Moreover, with many libraries, customizing user events can be hard to learn and tedious to program. Here is a list of commonly asked questions about building a FusionCharts interactive graph.Do I Need Coding Experience?
Building an interactive graph in FusionCharts is easy. You need to know very little coding. FusionCharts specifies all chart configurations and data using JSON objects.How Fast is the Learning Curve?
FusionCharts has a very fast learning curve. It doesn’t matter if you are a novice developer, data scientist, or a first-time FusionCharts user, you’ll be able to create a chart in minutes.Are Default FusionCharts Behaviors Sufficient?
FusionCharts defines the default behavior for all types of user interactions. As a developer or data scientist, there is a high chance that you will stick with the pre-defined behaviors. For example, tooltips, interactive legends, zooming, panning, and scrolling are all enabled by default. You don’t have to do much to add interactivity to your graphs.Is there any Documentation?
FusionCharts also has extensive online documentation with code examples for each and every graph, chart, and map.How Do I Build an Interactive Graph with FusionCharts?
FusionCharts comes with 100+ charts and graphs and 2000+ choropleth maps. There are numerous code examples for each type of chart and graph. Once you have decided on the type of data visualization you need, you can simply modify the code in your documentation and have a fully functional interactive graph up and running.How Long Does It Take to Integrate a FusionCharts Interactive Graph into My App?
FusionCharts ships with easy-to-use APIs that allow you to integrate an interactive graph into software developed using your favorite tech-stack including Vue.js, Angular, React, Django, Javascript, Svelte and more. Using FusionCharts code examples as a base, you can have a fully functional interactive graph integrated into your app in minutes.What is the Final Verdict On the Speed of Developing an Interactive Graph?
 The simple answer is just a few minutes, provided you use FusionCharts! That’s right, you can build a beautiful, interactive, and responsive chart, map, or graph in a matter of minutes. All data presentations created via FusionCharts are interactive by default and there is not much you have to do to add more responsiveness.
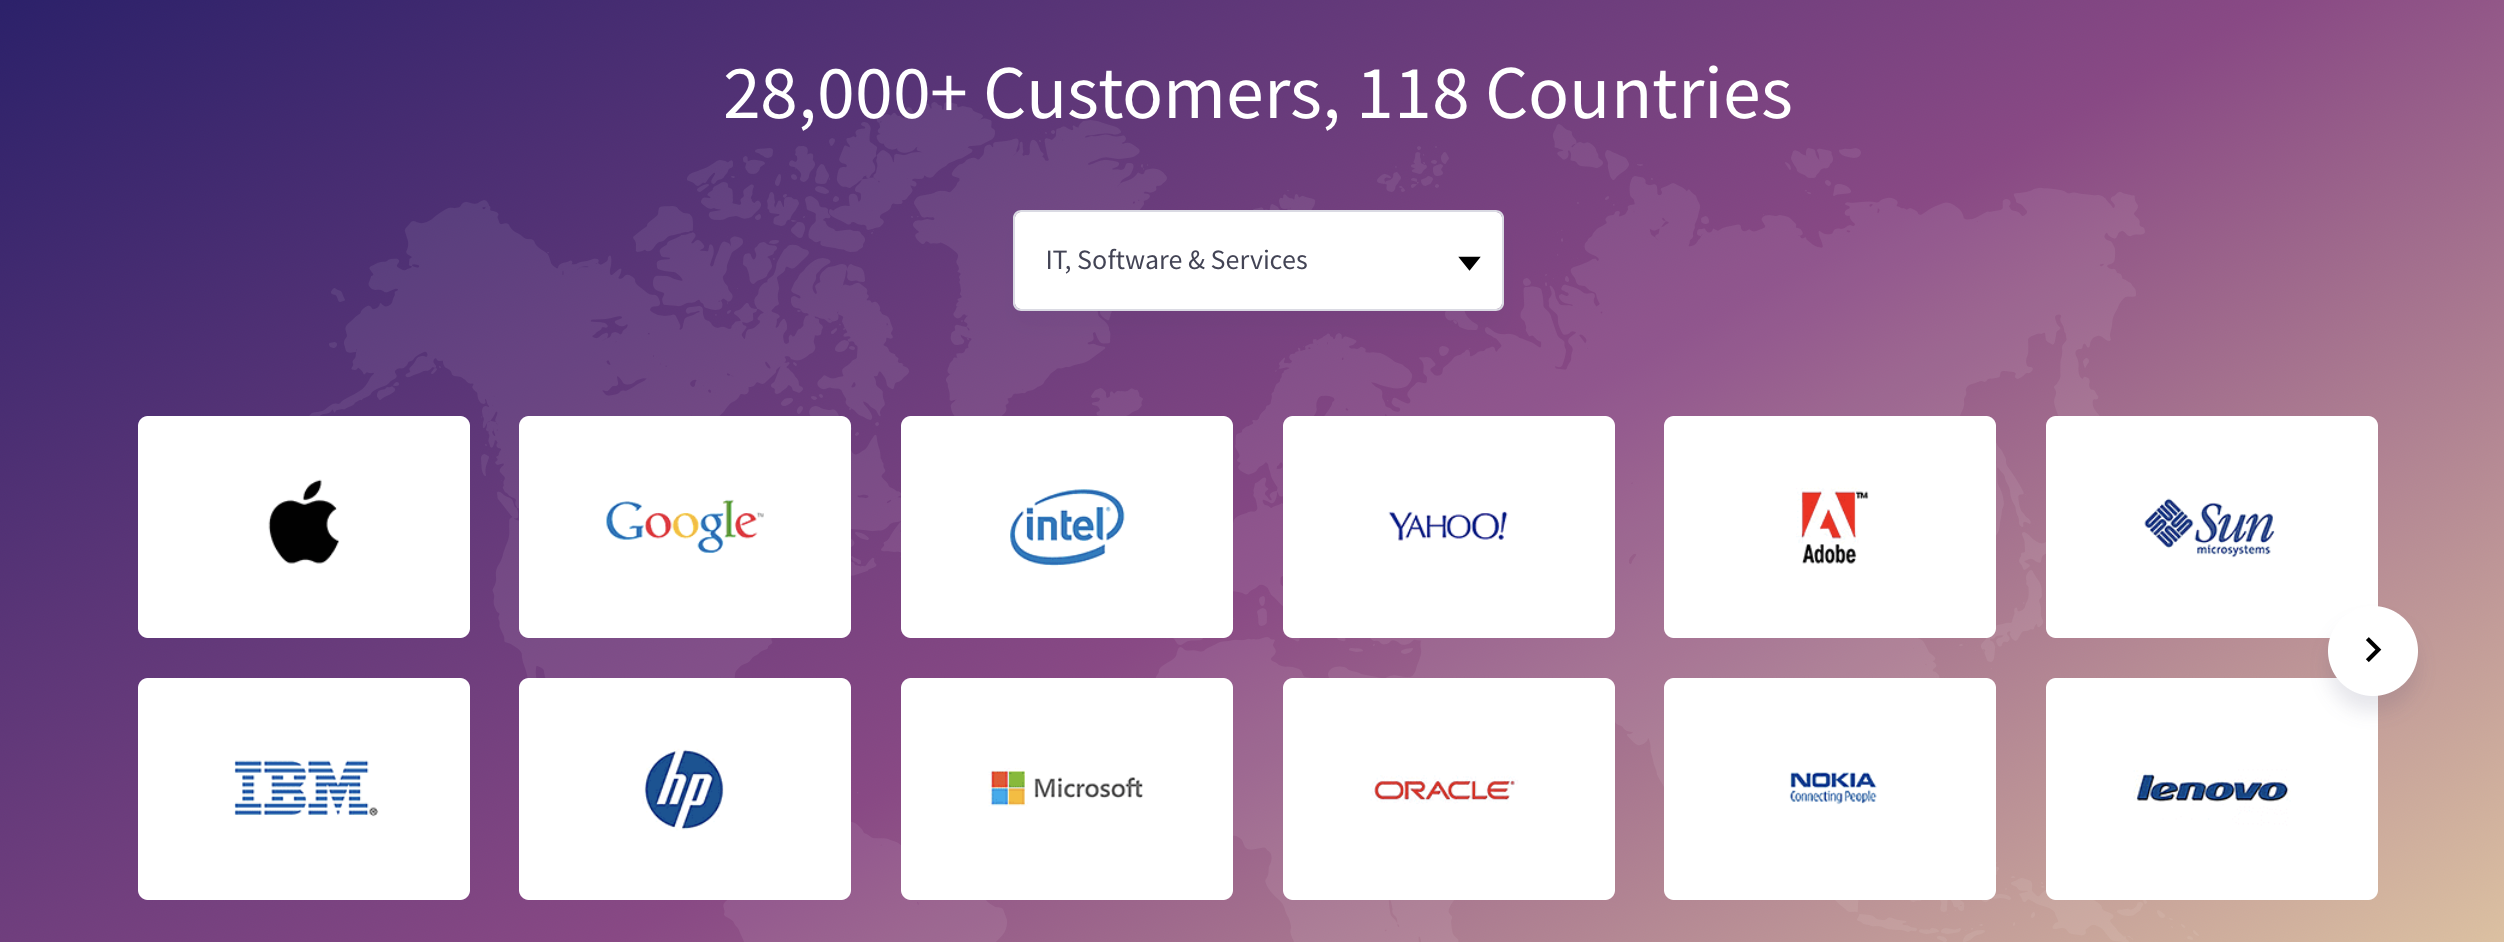
If you want to enhance your user experience with immersive and engaging data visualizations, FusionCharts is the smartest choice for you. Don’t waste your time with other graphing tools and libraries that provide little or no interactivity. If you are still not convinced, take a look at our customer base. It includes over 800,000 developers over 28,000 organizations including Intel, Philips, Adobe, IBM, Infosys, AutoDesk, and more.
You deserve the best! Don’t miss out on the best data visualization tool for interactive and responsive charts and graphs. Sign up for your free FusionCharts trial now.
The simple answer is just a few minutes, provided you use FusionCharts! That’s right, you can build a beautiful, interactive, and responsive chart, map, or graph in a matter of minutes. All data presentations created via FusionCharts are interactive by default and there is not much you have to do to add more responsiveness.
If you want to enhance your user experience with immersive and engaging data visualizations, FusionCharts is the smartest choice for you. Don’t waste your time with other graphing tools and libraries that provide little or no interactivity. If you are still not convinced, take a look at our customer base. It includes over 800,000 developers over 28,000 organizations including Intel, Philips, Adobe, IBM, Infosys, AutoDesk, and more.
You deserve the best! Don’t miss out on the best data visualization tool for interactive and responsive charts and graphs. Sign up for your free FusionCharts trial now.