In web development, mastering JavaScript charting libraries is crucial for keeping up with the fast-paced industry. These libraries empower developers to create compelling data visualizations, such as bar charts, pie charts, and line charts, to communicate insights from data analysis effectively. However, the complexity of these libraries can make working with them time-consuming. While traditional documentation offers valuable information, it often needs more contextual guidance to navigate these complexities efficiently. If you’ve explored using FusionCharts for data visualization in the past, you might be familiar with some of the challenges associated with traditional documentation. In a previous blog post, “Focus on the Magic, Not the Mundane: Ask FusionDev AI is Here“, we discussed how AI-powered documentation can revolutionize this process.
Table of Contents
The Problem with Traditional Documentation
Imagine diving into a new JavaScript charting library, eager to implement a sleek, interactive chart for your latest project. You’re greeted with extensive API references and tutorials that, while comprehensive, require substantial time investment to navigate and understand fully. Finding specific examples tailored to your needs can be like searching for a needle in a haystack, often leading to frustration and delays in development.
Is AI-Powered Documentation the New Standard?
AI-powered documentation tools are revolutionizing how developers interact with JavaScript charting libraries. These tools introduce a conversational approach to learning and problem-solving, acting as a smart assistant that fetches relevant API references, suggests tailored code examples, troubleshoots code issues, and provides interactive visualizations—all geared towards your specific project requirements.
The emergence of AI-powered tools aligns perfectly with the ever-evolving landscape of data visualization. In another blog post, “FusionCharts 4.0: Elevate Your Data Visualization with New Capabilities“, we explored the exciting new features of FusionCharts 4.0 that empower developers to create even more impactful data stories.
Ask FusionDev AI: Understanding User Intent and Functionality
Enter AI-powered documentation tools, poised to revolutionize how developers interact with JavaScript charting libraries. These tools leverage advancements in artificial intelligence, particularly natural language processing (NLP), to understand developer queries and deliver precisely what’s needed in real time. Imagine having an intelligent assistant that not only fetches API references but also suggests relevant examples, troubleshoots code issues, and provides interactive visualizations—all tailored to your project requirements.
How Ask FusionDev AI Works
Understanding User Intent
AI-powered documentation’s core lies in its ability to interpret and respond to developer queries effectively. By analyzing the context of each inquiry, these tools offer nuanced solutions beyond basic keyword matching. For instance, a developer seeking to implement a dynamic line chart can receive instant guidance on data formatting, animation options, and integration with backend APIs, all seamlessly integrated into their workflow.
Key Features and Functionality
- Intelligent Search: AI-powered tools provide context-aware search results, ensuring developers find exactly the information they need to make informed decisions about their visualizations. This eliminates the need to wade through irrelevant information, empowering developers to surface insights for key decision makers quickly.
- Code Suggestions: These tools offer relevant code snippets and examples based on the user’s current project and queries, significantly speeding up development time.
- Interactive Visualizations: Developers can interact with visual examples directly within the documentation, helping them understand complex concepts more intuitively.
Real-World Benefits and Use Cases
A recent survey by GitHub revealed that developers believe AI coding tools can help them meet performance standards. This suggests that AI-powered documentation goes beyond just improving efficiency; it can also empower developers to perform at a higher level by reducing the cognitive load associated with learning new libraries and ensuring they have access to best practices for code quality.
Imagine working with a popular charting library like FusionCharts and needing to create a real-time line chart with interactive tooltips. AI-powered documentation can instantly surface relevant FusionCharts code examples and tutorials specific to FusionCharts’ Javascript charting library, saving you valuable time and frustration.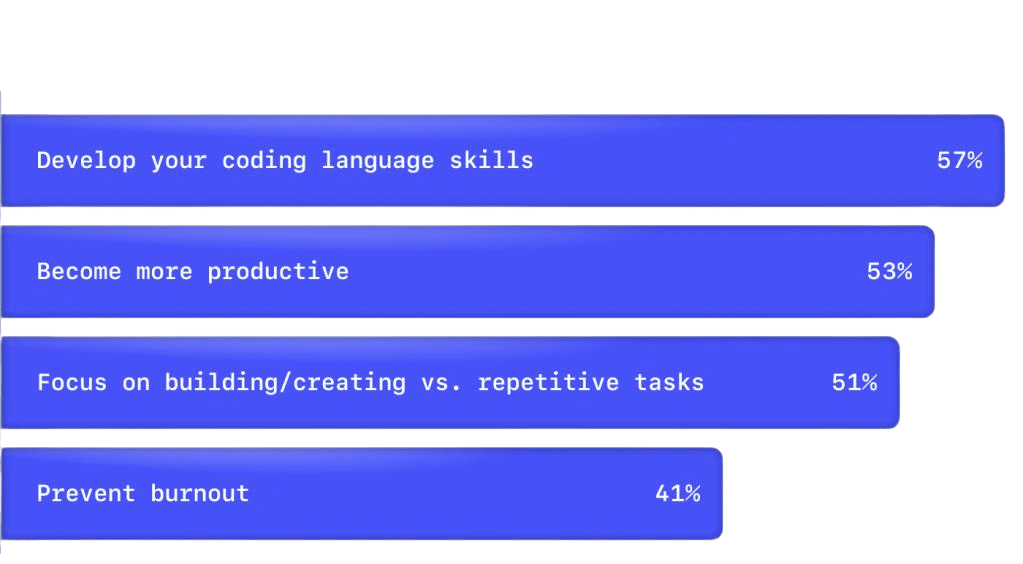
The benefits of AI-powered documentation extend far beyond efficiency gains. Developers experience reduced cognitive load as AI tools streamline the learning curve associated with new libraries. Moreover, these tools enhance code quality by ensuring developers have access to best practices and optimized solutions, ultimately leading to faster development cycles and more robust applications.
Consider a scenario where a developer, tasked with creating an interactive bar chart for a financial dashboard, encounters a stumbling block with data visualization customization. With AI-powered documentation, the developer swiftly finds a tailored solution that includes code snippets for advanced data filtering and color mapping, enabling them to meet project deadlines without compromising on functionality or design.
This approach introduces the idea that AI-powered documentation can not only improve efficiency but also contribute to overall developer performance.
The Future of AI-Powered Documentation
Looking ahead, the future of AI-powered documentation holds exciting possibilities. Advancements may include personalized content delivery based on individual developer preferences and automatic generation of code snippets tailored to specific chart types and data sets. As AI continues to refine its understanding of developer needs, these tools are poised to become indispensable allies for optimizing development workflows, fostering innovation in web application design, and ultimately helping developers create more impactful data stories.
Conclusion
In conclusion, AI-powered documentation represents a significant leap forward for developers working with JavaScript charting libraries. By harnessing the capabilities of artificial intelligence, developers can experience faster learning curves, write cleaner code, and become more productive in web development. AI-powered tools push the boundaries of what’s possible in data visualization, empowering developers to create exceptional digital experiences that identify patterns, present data effectively, and ultimately lead to better business intelligence. Embrace the future of JavaScript charting with AI-powered tools and empower yourself to create data-driven applications with confidence and efficiency.
Explore the future of JavaScript charting with AI-powered documentation tools like Ask FusionDev AI. These platforms offer intelligent search, context-aware suggestions, and interactive visualizations tailored to your specific charting needs.
Additional resources:
You can find more details on how AI is specifically enhancing the JavaScript charting experience in 2024 in this blog post: “How AI is Enhancing the JavaScript Charting Experience in 2024”
Say Hi to Ask FusionDev AI