How to build a Viz App: Charting React vs Vue NPM Battle

In the last couple of years, React.js and Vue.js have been dominant names in the world of JavaScript frameworks. Developers across the globe have adopted and experimented with both of them in a large variety of projects. But in terms of sheer hype, it seems that Vue.js is leading the popularity battle.
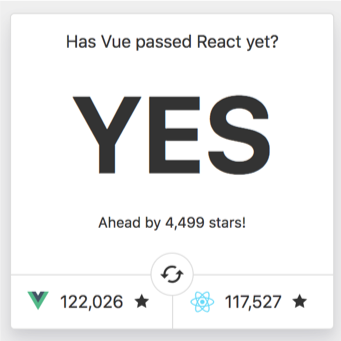
However, are Github Stars a good measure of a project’s success? Does it say anything about the impact it has made in the technology landscape? We had heated debates about it across our teams, and we concluded that Github Stars mean little, thanks to a tweet!
A web server that powers 38% of the Internet has 1,766 stars on GitHub. A library that adds color to your Node console has 3,206. pic.twitter.com/tGQJi3jYq1
— Ben Sandofsky (@sandofsky) June 15, 2018
Measure of Adoption
At FusionCharts, we love both React and Vue. Many of our core projects have been developed using either one of them, or we have strived to provide wrappers for both of them. However, as a data visualization company serving developers globally, we were extremely curious about how the two frameworks are adopted in real-world projects. We threw the opinions of our in-house experts out of the window, and decided to take a data-driven approach.
NPM being the de-facto registry for JavaScript packages, we defined our measure of adoption as the number of times a package has been downloaded from the NPM registry over a period of time. At the same time, we were also interested in observing how the download figures for React and Vue varies periodically.
We expected React to be the winner in this battle, because it has been around for a much longer time. It has a strong momentum gained from its proliferation as a dependency in a large number of projects. However, what stumped us is the sheer margin of the lead! Take a look at the data for just one week - the fateful week in which we did this experiment.

More Evidence
Being spirited engineers, one week of data was nowhere near enough! Vue fanboys in our organization demanded more evidence, and nothing short of a year worth of data would have relinquished the raging debate. So, we decided to go ahead and built a small application that plots data for different date ranges - last 7 days, 1 month, and 1 year.
The Vue camp strongly lobbied and showed great initiative to build the application with Vue.js (may be to increase the adoption by an iota 😜), and the POC for the application looked something like this:

The complete source code for the application is available on Github.
Building the Application
The debate was settled for good, and building the application was real fun:
- We pulled in the data using the NPM registry API (read more about it here)
- Let Vue manage the data flow and the view
- Added dropdown options for selecting the range of dates for which the plots will be shown
- The fantastic FusionCharts (with its Vue wrapper) did the rest
Once we achieved the functionality, we polished the design a bit and then deployed it. However, we also wanted to share the joy of creating something really cool and useful. So here it goes - a tutorial on how to build the application, that conclusively decides the winner of the NPM battle between React and Vue.
Prerequisites
To restrict the tutorial to a reasonable length, we assume that you have basic familiarity with the following (so that we don’t bore you with explanations of trivial stuff):
- HTML5, CSS3 (especially Bootstrap), and JavaScript (the ES6 way)
- The Node.js/NPM way of managing a project, and Webpack as part of the toolchain
- JavaScript frameworks - Vue.js in particular (if you are not familiar with Vue, here’s a great video tutorial series to get you up to speed)
- The command line interface of your system
Basic Installations
Ensure that npm is installed on your system, and the executable is available for the path in which you will create your project. With the prerequisite out of the way, execute the following commands from the terminal:
npm install -g vue@2 vue-cli@2
On successful execution, you will have the required version of vue-cli as a command line tool on your system. Remember that vue is a prerequisite for vue-cli.
Create the Project Scaffolding
The vue-cli tool that you have just installed is capable of generating a project scaffolding - a structure with some boilerplate code. To create the project, execute the following command from the terminal:
vue init webpack-simple npm_downloads
The vue-cli tool downloads the webpack-simple template on your system, and creates a directory called npm_downloads. Along the way, it asks you some simple questions - opt for the defaults, and say N to the last question regarding using sass.
Once the project directory is created, do the following:
Navigate to the project directory.
cd npm_downloadsInstall the dependencies mentioned in the project’s
package.json.npm installStart the development server.
npm run dev
And bang! Your default browser loads a webpage, and greets you with the default Vue app. Congratulations, you have taken the first step towards building an insanely cool application!
Open the project in your favorite code editor/IDE, and you are all set. At this point, the project structure roughly looks like:
    |-- node_modules/
    | |-- ... lots of node module directories ...
    |-- .editorconfig
    |-- .babelrc
    |-- .gitignore
    |-- README.md
    |-- index.html
    |-- package.json
    |-- package-lock.json
    |-- src/
    | |-- App.vue
    | |-- assets/
    | |--|-- logo.png
    |-- main.js
    `-- webpack.config.js
Modify the Default Project
Although the scaffolding is good enough for the default application, it doesn't quite suit the requirements of our project. To make the project our own, we must tweak some of the files, and create new directories and files.
Execute the following steps to wrap up the peripheral activities quickly, so that in the next section we can focus on the core of the application. Going forward, we will mention all commands, directories, and file paths relative to the project’s root directory.
STEP 1: Stop the development server - usually going to the terminal and pressing Ctrl+C does the trick.
STEP 2: Modify the code in index.html to match the code below:
<!DOCTYPE html>
<html lang="en">
  <head>
    <meta charset="utf-8">
    <meta http-equiv="Content-Type" content="text/html;charset=utf-8" />
    <meta http-equiv="X-UA-Compatible" content="IE=edge">
    <meta name="viewport" content="width=device-width, initial-scale=1, shrink-to-fit=no">
    <link rel="stylesheet" href="//maxcdn.bootstrapcdn.com/bootstrap/4.0.0/css/bootstrap.min.css">
    <link rel="stylesheet" type="text/css" href="src/css/style.css">
    <title>NPM Downloads</title>
  </head>
  <body>
    <div id="app"></div>
    <script src="/dist/build.js"></script>
  </body>
</html>
Notice the <div> with id=app - this is where the component defined in src/App.vue will be rendered. In the <template> of src/App.vue, the topmost <div> contains the same id, so that the two matches and Vue does not have any confusion. Also, in src/main.js, we set the Vue instance to control the element with id of app.
STEP 3: Delete the image logo.png in the directory src/assets/, and save the following .svg files in that directory:
- github_fork_icon.svg
- heart.svg
- react.svg
- vue.svg
STEP 4: Create the directory src/css/, and within that, create a file style.css. Copy the following code and paste it in the newly created CSS file:
@import url('https://fonts.googleapis.com/css?family=Source+Sans+Pro:400,600,700');

body {
  font-family: 'Source Sans Pro', sans-serif;
  overflow-x: hidden;
  color: #212344;
}
a{
  color: #6957DA;
}
/* Header */

.page-header{
    position: relative;
    background: linear-gradient(315.88deg, #70CEE6 0%, #12298E 100%);
    box-shadow: 0 8px 10px 0 rgba(105,87,218,0.06);
    padding: 4rem 2rem 5rem;
}
.desc{
  position: absolute;
  margin: 0 auto;
  left: 0;
  right: 0;
  bottom: 40px;
}
#multiaxisLineChart {
  border: 1px solid #d7d7d77b;
  margin: 1rem 0;
}
.page-header h1{
  font-size:2.8rem;
  margin-bottom: 40px;
  font-weight:600;
  color: #fff;
}

.page-header h5{
  font-weight:400;
  opacity: 0.9;
  color: #fff;
}

.git-fork{
  position: absolute;
  right: 0;
  top: 0;
  cursor: pointer;
  transition: 0.3s;
  -webkit-transition: 0.3s;
  -moz-transition: 0.3s;
  -ms-transition: 0.3s;
  -o-transition: 0.3s;
}
.git-fork:hover{
  transform: scale(1.08);
  -webkit-transform: scale(1.08);
  -moz-transform: scale(1.08);
  -ms-transform: scale(1.08);
  -o-transform: scale(1.08);
  transition: 0.3s;
  -webkit-transition: 0.3s;
  -moz-transition: 0.3s;
  -ms-transition: 0.3s;
  -o-transition: 0.3s;
}
#widget{
  width: 400px;
  padding: 1rem;
  width:400px;
  background-color: #fff;
  box-shadow: 0 8px 10px 0 rgba(105,87,218,0.06);
  position: absolute;
  margin: 0 auto;
  left: 0;
  right: 0;
  bottom: -25px;
  border-radius: 4px;
  -webkit-border-radius: 4px;
  -moz-border-radius: 4px;
  -ms-border-radius: 4px;
  -o-border-radius: 4px;
}
.tech-icon{
  width:32px;
}
.chart-container{
  margin-top: 4rem;
}
#dropdown span{
  opacity: 0.6;
}
#dropdown select{
  border: 1px solid #d4d4d4;
}
#dropdown select:focus{
  outline: none;
}
footer{
  background-color: rgba(216, 216, 216, 0.105);
  padding: 10px;
  width: 100%;
  font-size: 14px;
  color: rgba(67,68,86,0.66);
}
@media (max-width:992px){
  .page-header h1{
    font-size:2.5rem;
  }
}
@media (max-width:568px){
    #widget{
      width: 90%;
      bottom: -50px;
    }
    .desc{
      bottom: 70px;
    }
    #widget .col-sm-6:first-child{
      border-right: 0 !important;
      border-bottom: 1px solid #f5f6ff !important;
      padding-bottom: 10px;
    }
    #widget .col-sm-6:last-child{
      padding-top: 15px;
    }
    .page-header{
      padding-bottom: 7rem;
    }
}
@media (max-width:768px){
  #dropdown{
    text-align: center !important;
  }
  .chart-container {
    margin-top: 6rem;
  }
}
@media (min-width:1600px){
  .page-header{
    padding: 5rem 2rem 6rem;
  }
  #widget{
    margin-top: 30px;
  }
  footer{position: absolute;
  bottom: 0;}
}
STEP 5: Rewrite the code in src/main.js to import a new set of dependencies and resolve them, followed by instantiating a new Vue instance that will control our application:
// Import the dependencies - packages and modules
import Vue from 'vue';
import App from './App.vue';
import FusionCharts from 'fusioncharts';
import Charts from 'fusioncharts/fusioncharts.charts';
import Widgets from 'fusioncharts/fusioncharts.widgets';
import PowerCharts from 'fusioncharts/fusioncharts.powercharts';
import FusionTheme from 'fusioncharts/themes/fusioncharts.theme.fusion';
import VueFusionCharts from 'vue-fusioncharts';

// Resolve the dependencies
Charts(FusionCharts);
PowerCharts(FusionCharts);
Widgets(FusionCharts);
FusionTheme(FusionCharts);

// Instruct Vue to globally register components
Vue.use(VueFusionCharts, FusionCharts);

// Instantiate a new Vue instance that controls our application
new Vue({
  el: '#app',
  render: h => h(App)
});
For more information on the code written here, refer to Vue.js Charts.
STEP 6: Get rid of the boilerplate code in src/App.vue, and put your own (temporary) code in it:
    <template>
      <div id="app">
        <p>{{ package_1 }} vs {{ package_2 }} - The NPM Battle</p>
      </div>
    </template>

    <script>
    export default {
      name: "app",
      data() {
        return {
          package_1: "React",
          package_2: "Vue"
        };
      },
      methods: {
        // Syntax=> method_name: function() { // function body here },
      },
    };
    </script>

    <style>
    </style>
If you are not familiar with Vue or any other JavaScript framework, the {{ }} might come across as a surprise to you. At this point, it’s enough to know that this is Vue’s way of binding data (defined in the data() function) to the <template>, so that the final HTML is dynamically rendered based on the data. You may read more about basic data binding here.
STEP 7: Modify the configurations in webpack.config.js to match the following:
var path = require('path')
var webpack = require('webpack')

module.exports = {
  entry: ['babel-polyfill', './src/main.js'],
  output: {
    path: path.resolve(__dirname, './dist'),
    publicPath: '/dist/',
    filename: 'build.js'
  },
  module: {
    rules: [
      {
        test: /\.css$/,
        use: [
          'vue-style-loader',
          'css-loader'
        ],
      },      {
        test: /\.vue$/,
        loader: 'vue-loader',
        options: {
          loaders: {
          }
          // other vue-loader options go here
        }
      },
      {
        test: /\.js$/,
        loader: 'babel-loader',
        exclude: /node_modules/
      },
      {
        test: /\.(png|jpg|gif|svg)$/,
        loader: 'file-loader',
        options: {
          name: '[name].[ext]?[hash]'
        }
      }
    ]
  },
  resolve: {
    alias: {
      'vue$': 'vue/dist/vue.esm.js'
    },
    extensions: ['*', '.js', '.vue', '.json']
  },
  devServer: {
    historyApiFallback: true,
    noInfo: true,
    overlay: true,
    host: '0.0.0.0',
    port: 8080
  },
  performance: {
    hints: false
  },
  devtool: '#eval-source-map'
}

if (process.env.NODE_ENV === 'production') {
  module.exports.devtool = '#source-map'
  // http://vue-loader.vuejs.org/en/workflow/production.html
  module.exports.plugins = (module.exports.plugins || []).concat([
    new webpack.DefinePlugin({
      'process.env': {
        NODE_ENV: '"production"'
      }
    }),
    new webpack.optimize.UglifyJsPlugin({
      sourceMap: true,
      compress: {
        warnings: false
      }
    }),
    new webpack.LoaderOptionsPlugin({
      minimize: true
    })
  ])
}
STEP 8: Modify the packages and dependencies in package.json to match the following:
{
  "name": "npm_downloads",
  "description": "A Vue.js project combining NPM download counts and FusionCharts",
  "version": "1.0.0",
  "author": "Your Highness ;-p ",
  "license": "MIT",
  "private": true,
  "scripts": {
    "dev": "cross-env NODE_ENV=development webpack-dev-server --open --hot",
    "build": "cross-env NODE_ENV=production webpack --progress --hide-modules"
  },
  "dependencies": {
    "babel": "^6.23.0",
    "babel-cli": "^6.26.0",
    "babel-polyfill": "^6.26.0",
    "fusioncharts": "^3.13.3",
    "vue": "^2.5.11",
    "vue-fusioncharts": "^2.0.4"
  },
  "browserslist": [
    "> 1%",
    "last 2 versions",
    "not ie <= 8"
  ],
  "devDependencies": {
    "babel-core": "^6.26.0",
    "babel-loader": "^7.1.2",
    "babel-preset-env": "^1.6.0",
    "babel-preset-stage-3": "^6.24.1",
    "cross-env": "^5.0.5",
    "css-loader": "^0.28.7",
    "file-loader": "^1.1.4",
    "vue-loader": "^13.0.5",
    "vue-template-compiler": "^2.4.4",
    "webpack": "^3.6.0",
    "webpack-dev-server": "^2.9.1"
  }
}
STEP 9: Reinstall the packages to include the new packages and dependencies mentioned in package.json, by executing the following command from the terminal:
npm install
STEP 10: Restart the development server from the terminal:
npm run dev
Customizing src/App.vue
Now that we are done with the peripheral activities, we can concentrate on understanding the core of the application, which essentially is the src/App.vue component module.
In the last section, we replaced the boilerplate code in src/App.vue with our own little thing. But that’s not even the tip of the iceberg! Our Vue application contains only one component - the root component itself. Therefore, all the component code we write for our application will be housed in App.vue, and will be centrally controlled by the Vue instance we initiated in src/main.js.
As with any .vue file, the code is divided into three chunks - <template>, <script>, and <style>. Before we dive deeper into the explanations, let’s take a look at the schematics:
<template>
  <div id="app">
    <!-- HTML template code full of {{ }} as placeholders for dynamic data -->
  </div>
</template>

<script>
export default {
  name: "app",
  data() { // data must be a function
    return {
      // Syntax=> data_object_1: "value_1",
    };
  },
  methods: {
    // Syntax=> method_name: function() { // function body here },
  },
  mounted: function(){ // one of the instance lifecycle hooks provided by Vue
    // function body here
  },
};
</script>

<style>
  <!-- CSS here, if necessary -->
</style>
Complete Code of src/App.vue
For the time being, keep the schematics in mind and carefully read the complete code for App.vue (paste it in your project and see the working application on browser):
<template>
  <div id="app">
    <div class="container-fluid page-header text-center">
        <h1>React vs Vue - The NPM Battle</h1>
        <h5 class="mb-3 desc">Total Downloads in the Last 1 Year</h5>
        <div id="widget">
          <div class="row">
            <div class="col-sm-6 border-right">
              <span><img title="react" src="./assets/react.svg" alt="react" width="32" class="mr-2"/></span>
              {{ dataFromNPM.reactTillDate }}<img title="download" src="./assets/download.svg" alt="download" class="ml-2"/>
            </div>
            <div class="col-sm-6">
               <strong><img title="vue" src="./assets/vue.svg" alt="vue" class="mr-2" width="26"/></strong>
              {{ dataFromNPM.vueTillDate }}<img title="download" src="./assets/download.svg" alt="download" class="ml-2" />
            </div>
          </div>
        </div>
        <div class="git-fork">
          <img title="fork in github" src="./assets/github_fork_icon.svg" alt="github_fork_icon" >
        </div>
    </div>
    <div class="container chart-container">
          <div id="dropdown" class="text-right">
            <span>Showing downloads for:</span>
            <select name="dateRange" id="dateRange" @change="setChartDetails">
              <option value="7">Last 7 days</option>
              <option value="30">Last 30 days</option>
              <option value="365">Last 365 days</option>
            </select>
          </div>
          <div id="multiaxisLineChart">
            <fusioncharts type="msspline" width="100%" height="325" :datasource="mydatasource"></fusioncharts>
          </div>
    </div>
    <footer class="text-center">
      <p class="mb-0">Made with <span><img title="heart" src="./assets/heart.svg" alt="heart" width="14" class="mr-1"/></span> by <a href="https://fusioncharts.com">FusionCharts</a></p>
    </footer>
  </div>
</template>

<script>
export default {
  name: "app",
  data() {
    return {
      dateRangeSelected: "",
      dataFromNPM: {
        vueTillDate: "",
        reactTillDate: "",
        vueDataBlob: [],
        reactDataBlob: []
      },
      slicedData: {
        last7days: {
          vue: [],
          react: []
        },
        last30days: {
          vue: [],
          react: []
        },
        last365days: {
          vue: [],
          react: []
        }
      },
      mydatasource: {
        chart: {
          caption: "Variation of React and Vue Downloads from NPM",
          subcaption: "",
          yaxisname: "Downloads",
          numvisibleplot: "7",
          drawcrossline: "1",
          theme: "fusion",
          rotatelabels = "",
        },
        categories: [
          {
            category: []
          }
        ],
        dataset: [
          {
            seriesname: "React",
            anchorBgColor: "#876EA1",
            renderAs: "spline",
            data: []
          },
          {
            seriesname: "Vue",
            anchorBgColor: "#72D7B2",
            data: [],
            renderAs: "spline"
          }
        ]
      }
    };
  },
  methods: {
    getStartEndDate: function() {
      var today = new Date();
      var yyyy = today.getFullYear();
      var mm = today.getMonth() + 1; //January is 0!
      var dd = today.getDate();
      if (dd < 10) {
        dd = "0" + dd;
      }
      if (mm < 10) {
        mm = "0" + mm;
      }
      // Today is end, 1 year before is start
      var endDate = yyyy + "-" + mm + "-" + dd;
      var startDate = (parseInt(yyyy, 10) - 1).toString() + "-" + mm + "-" + dd;
      return { startDate: startDate, endDate: endDate };
    },
    completeURL: function(packageName) {
      var dateRange = this.getStartEndDate();
      var start = dateRange.startDate;
      var end = dateRange.endDate;
      var url =
        "https://api.npmjs.org/downloads/range/" +
        start +
        ":" +
        end +
        "/" +
        packageName;
      return url;
    },
    getVueData: async function() {
      var url = this.completeURL("vue");
      await fetch(url)
        .then(response => response.json())
        .then(data => {
          this.dataFromNPM.vueDataBlob = data.downloads;
          // array reversal necessary because of how the API returns the data
          this.dataFromNPM.vueDataBlob = this.dataFromNPM.vueDataBlob.reverse();
          var count = 0;
          for (var i = 0; i < data.downloads.length; i++) {
            count = count + data.downloads[i].downloads;
          }
          this.dataFromNPM.vueTillDate = count.toLocaleString("en");
        })
        .catch(error => console.error(error));
    },
    getReactdata: async function() {
      var url = this.completeURL("react");
      await fetch(url)
        .then(response => response.json())
        .then(data => {
          this.dataFromNPM.reactDataBlob = data.downloads;
          // array reversal necessary because of how the API returns the data
          this.dataFromNPM.reactDataBlob = this.dataFromNPM.reactDataBlob.reverse();
          var count = 0;
          for (var i = 0; i < data.downloads.length; i++) {
            count = count + data.downloads[i].downloads;
          }
          this.dataFromNPM.reactTillDate = count.toLocaleString("en");
        })
        .catch(error => console.error(error));
    },
    setSlicedData: function() {
      // last 7 days
      this.slicedData.last7days.vue = this.dataFromNPM.vueDataBlob.slice(1, 8);
      this.slicedData.last7days.react = this.dataFromNPM.reactDataBlob.slice(
        1,
        8
      );
      // last 30 days
      this.slicedData.last30days.vue = this.dataFromNPM.vueDataBlob.slice(
        1,
        31
      );
      this.slicedData.last30days.react = this.dataFromNPM.reactDataBlob.slice(
        1,
        31
      );
      // last 365 days
      this.slicedData.last365days.vue = this.dataFromNPM.vueDataBlob.slice(
        1,
        366
      );
      this.slicedData.last365days.react = this.dataFromNPM.reactDataBlob.slice(
        1,
        366
      );
    },
    setChartDetails: function() {
      // Clean up data assignments from previous cases
      this.mydatasource.categories[0].category = [];
      this.mydatasource.dataset[0].data = [];
      this.mydatasource.dataset[1].data = [];
      // main logic for dynamic data ssignment to chart data structure
      this.dateRangeSelected = document.getElementById("dateRange").value;
      this.mydatasource.chart.subcaption =
        "Last " + this.dateRangeSelected + " days";
      if (this.dateRangeSelected === "7") {
        this.mydatasource.chart.rotatelabels = "0";
        for (var i = 0; i < this.slicedData.last7days.vue.length; i++) {
          var categoryObject = { label: this.slicedData.last7days.vue[i].day };
          this.mydatasource.categories[0].category.push(categoryObject);

          var reactDatasetValues = {
            value: this.slicedData.last7days.react[i].downloads.toString()
          };
          this.mydatasource.dataset[0].data.push(reactDatasetValues);

          var vueDatasetValues = {
            value: this.slicedData.last7days.vue[i].downloads.toString()
          };
          this.mydatasource.dataset[1].data.push(vueDatasetValues);
        }
      } else if (this.dateRangeSelected === "30") {
        this.mydatasource.chart.rotatelabels = "1";
        for (var i = 0; i < this.slicedData.last30days.vue.length; i++) {
          var categoryObject = { label: this.slicedData.last30days.vue[i].day };
          this.mydatasource.categories[0].category.push(categoryObject);
          var reactDatasetValues = {
            value: this.slicedData.last30days.react[i].downloads.toString()
          };
          this.mydatasource.dataset[0].data.push(reactDatasetValues);
          var vueDatasetValues = {
            value: this.slicedData.last30days.vue[i].downloads.toString()
          };
          this.mydatasource.dataset[1].data.push(vueDatasetValues);
        }
      } else if (this.dateRangeSelected === "365") {
        this.mydatasource.chart.rotatelabels = "0";
        for (var i = 0; i < this.slicedData.last365days.vue.length; i++) {
          var categoryObject = {
            label: this.slicedData.last365days.vue[i].day
          };
          this.mydatasource.categories[0].category.push(categoryObject);
          var reactDatasetValues = {
            value: this.slicedData.last365days.react[i].downloads.toString()
          };
          this.mydatasource.dataset[0].data.push(reactDatasetValues);
          var vueDatasetValues = {
            value: this.slicedData.last365days.vue[i].downloads.toString()
          };
          this.mydatasource.dataset[1].data.push(vueDatasetValues);
        }
      } else {
        alert("Data not available!");
      }
    }
  },
  mounted: async function() {
    await this.getVueData();
    await this.getReactdata();
    this.setSlicedData();
    this.setChartDetails();
  },
};
</script>

<style>
</style>
In the App.vue module, we haven’t written any CSS within the <style> section - all of them have been banished to src/css/style.css. So, we are effectively left with two chunks - the <template> and the <script>. Let’s understand the implementation at a granular level by tearing it apart into the respective chunks.
<template>
The template of any .vue module primarily consists of the following:
- Static HTML content that forms the matrix of the webpage we want to create.
- Dynamic content, or rather data, within the
{{ }}. The placeholders within{{ }}are bound to the data objects returned by thedata()function in the<script>section of the code. For example, the{{ dataFromNPM.reactTillDate }}is bound to thedataFromNPM.reactTillDatedata object. - Custom HTML elements with their own set of attributes. In Vue’s parlance, these are called components - reusable units of code that we can plug into the HTML.
The values of the attributes (for both traditional HTML elements, or custom components) can either be fixed, or dynamically bound to the data objects. For example, <fusioncharts> is a custom component that we have imported and resolved in the src/main.js file, whose datasource attribute is dynamically linked with the mydatasource data object. Read more about the <fusioncharts> component here. For more information on data binding, consult the official documentation.
In case of event based attributes like onchange, onclick, etc., the values might be method names. When the events are triggered, the associated method gets executed. For example, the traditional HTML element <select> has an event attribute onchange. In Vue syntax, we use the shorthand directive @ as a substitute for v-on:, followed by change. Thus, when we write @change=setChartDetails, Vue immediately understands that when a different dropdown option is selected by the user, the setChartAttributes method must be executed. Read more about event handling here.
Apart from the aspects explained above, the rest of the template code is Frontend Development 101, and you should be easily able to map it with the webpage. Let’s move on to the next chunk, which is the most exciting part of the project.
<script>
This is where all the pitch dark voodoo happens, and you are welcome to join our select group of elite sorcerers! The code here primarily deals with the following:
- The
data()function that makes our application’s content dynamic - Various properties like
methods,mounted,watch, etc. that casts spells on the data objects returned bydata(). In other words, the data manipulation and flow control is entrusted with these properties of the component.
For our project, the basic idea of the data manipulation and flow control is somewhat like this:

Keep the big picture in mind while we dig in, so that you understand how the smaller pieces of the puzzle fit together.
The <script> part of App.vue starts with export default { }, which depicts the code this module makes publicly available for consumption by other stuff in the system.
Although not used for this module, the opening <script> tag is often followed by import statements, so that we can make use of code written in other files - it’s quite similar to how we write modular JavaScript code in a Node environment.
Inside the export default { } object, we encounter a barrage of nested objects and functions, which are called properties in Vue’s scheme of things. Brief explanations of the properties are given below:
name
The first property is name, whose value is same as the div id where everything related to this component will be eventually rendered.
data()
To completely understand the implementation, it is extremely important that you cross-reference the data() and the methods: { } - they are intricately related. Also, the nested data objects are not mentioned below - please read the source code of App.vue alongside the descriptions.
The data() function returns all the data objects that are necessary for this component:
dateRangeSelected: ""
This object gets populated based on the user’s input from the dropdown. The possible values are: 7, 30, 365.
See the code for the <select> element in the <template> to fully understand the data flow, especially when the setChartDetails method is triggered by the @change event.
dataFromNPM: {}
This object hosts the data received from the NPM registry API, when the getVueData and getReactData methods are executed.
Each of the nested objects are for a specific purpose:
vueDataBlobandreactDataBlobreceives the entire data chunk of the last 365 days for Vue and React respectively. They also act as the data source from where data will be further sliced and put under three buckets - 7days, 30 days, and 365 days.- Simple counter increment logic is applied in the
getReactDataandgetVueDatamethods to calculate the total downloads for the last 365 days. Once calculated, the final download counts are pushed to thereactTillDateandvueTillDateobjects.
slicedData: {}
This object gets populated when a dropdown option is selected:
- either by the browser while mounting the Vue instance (see the working of the
mountedlifecycle hook) - or by the user manually selects an option from the dropdown
mydatasource: {}
This object is at the heart of creating the chart.
It has been referenced from the datasource attribute of the <fusioncharts> component in the <template>. In other words, datasource is bound to mydatasource using the v-bind directive of Vue (whose shorthand is :). Whenever mydatasource is dynamically updated by the setChartDetails method, the changes gets automatically reflected in the chart rendered using <fusioncharts>.
Note that the structure of mydatasource has not been pulled out of thin air - it directly maps the necessary data structure for the msspline chart type of FusionCharts.
Read the comments given on some lines of the code to uncover important and interesting aspects of the configuration and dynamic data binding.
methods: {}
The methods: { } property encapsulates other objects that are essentially functions. These functions are executed when certain events are triggered by the user, or the browser. The primary role of these methods is to manipulate the data.
Note: Refer to the descriptions of the data objects - you will get a deeper understanding of the purpose of each method written for this application. Also, read the source code along with the descriptions provided below.
getStartEndDate()
This method:
- Generates the current date (YYYY-MM-DD) from the client machine
- Calculates the date for day which is exactly 365 back (same format)
- Returns the two dates
completeURL(packageName)
The NPM Registry Public API provides a nice way of constructing a GET request URL based on the date ranges for which we need the downloads data.
This method:
- Accepts a package name (React/Vue) as argument
- Calls
getStartEndDate()to get the date range - Returns a complete and valid query URL using a base URL, package name, and date range
getVueData()
This is an asynchronous method that:
- Calls
completeURL(), and passes"vue"as argument to generate a valid query URL for getting Vue downloads data (for the selected date range) - Synchronously (using
await, to avoid the callback hell) implements a GET request to the API, using the godsendfetch - Pushes data into
dataFromNPM.vueDataBlobanddataFromNPM.vueTillDate(after some calculations)
getReactData()
It does the same thing as getVueData() does, but for "react".
setSlicedData()
The setSlicedData method is indirectly called due to user/browser triggered event, which then:
- takes data from
dataFromNPM.vueDataBlobanddataFromNPM.reactDataBlob - slices it based on the date range for which the chart needs to be created
- pushes it in the respective buckets (self evident from the names)
setChartDetails()
This is a mammoth method, at least in comparison to the other methods we have written. It does a lot of things, which includes:
- Flushing out the old data stored in:
mydatasource.categories[0].categorymydatasource.dataset[0].datamydatasource.dataset[1].data
- Setting the 'rotatelabels` chart attribute conditionally
- Pushing data into
dateRangeSelected, based on the current value of the selected dropdown option - Dynamically generation the chart’s
subcaption, based on the date range for which the chart will be displayed - Conditionally pushing new data into the objects that was cleared in Step 1, based on the selected date range
mounted: function() {}
The mounted property is a lifecycle hook, that gets triggered immediately after the Vue instance is mounted on the DOM. The value of mounted is a function, which in turn sequentially calls other functions defined in the methods. The sequence in which the methods are called is of critical importance for the application to work!
    mounted: async function() { // async function, calling other methods sequentially
        // wait for the asynchronous methods to finish their job
        await this.getVueData(); // get Vue data from the API
        await this.getReactdata(); // get React data from the API
        this.setSlicedData(); // slice the data and push them to appropriate data objects
        this.setChartDetails(); // dynamically update chart configurations
      },
Using the Application
The application that we have just build is gorgeous, and quite simple to use. However, we would like to bring your attention to a few features that are not so obvious:
Dynamic Data Annotations
Based on the hover position of your mouse pointer, the figures in the annotations either gets highlighted, or fades out.


Toggling Plots ON/OFF
you can do this for either Vue, or React, or both - simply click the legends at the bottom of the chart. Also, the Y-axis responds to your interactions and adjusts the scale accordingly.


Further Enhancements
Adding Features
Although the objective of the project was great, it’s quite limited in scope. You can always enhance a project in ways limited only by your own imagination. For example, you can add a mechanism so that a user can provide multiple NPM packages of her choice as input, and the application generates data plots for all of them.
We strongly encourage you to try extending the application by adding features like this - it makes the application more useful, and further consolidates your understanding.
Production Deployment
Now that we have finished developing the application, you should try to deploy it. We don’t endorse any particular way or platform for deploying applications, so we leave it up to you to research and decide on what works for you.
From the applications’ perspective, all you need to do is tweak some of the configuration settings mentioned in webpack.config.js, so that your application is bundled properly in a production environment and then served to the user requesting it. To learn about configuring Webpack for production deployment, either consult this nice post, or refer to the official documentation.
Getting Licensed Version of FusionCharts
You might have noticed that the chart in your application contains a small mention of FusionCharts at the left bottom. It’s OK for non-commercial or hobby projects to display the FusionCharts water mark. However, when you deploy your application, or use it in a professional setting, we strongly recommend to get a license that suits your requirements.
Using FusionTime and FusionExport
This project deals with data that varies with time, and the variation may or may not be statistically correlated. For such scenarios, it’s ideal to use FusionTime - it tremendously reduces the development complexities for rendering charts, and makes your visualization much more effective and appealing.
Also, if you want to export the data from charts for doing statistical analysis, or export the rendered charts/dashboards in various formats with custom branding, we have a one-stop solution - FusionExport!