Twitter’s New Analytics Dashboard: All you need to know!

With data-driven insights becoming more and more mainstream, Independent Software Vendors (ISVs) are continuously trying to up the engagement quotient of their applications and provide a more comprehensive experience by providing users with actionable insights.
[We analyzed this trend in detail in our white paper Dashboards—Helping ISVs create a competitive advantage in a data-driven age.]
Continuing with this trend, Twitter extended its analytics dashboard to include organic tweets. Earlier, analytics was available only for Promoted Tweets and marketers had to rely on third-party apps to get insights on their organic tweets.
With the “enhanced Tweet activity dashboard”, all Twitter advertisers, Twitter Card publishers, and verified users can measure the performance of their organic tweets as well. So if you belong to either of these categories, here’s what to expect from your new dashboard:
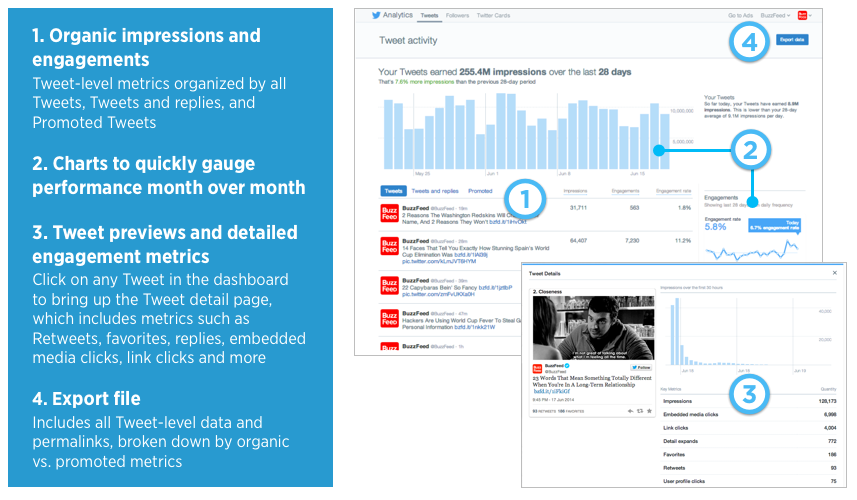 Image Source: Twitter
1. Organic impressions and engagements:
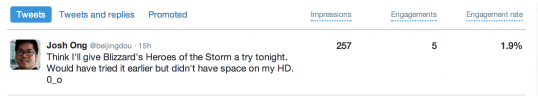
Image Source: TheNextWeb
You get tweet-level metrics (Impressions, Engagement and Engagement rate) organized by all Tweets, Tweets and replies, and Promoted Tweets.
2. Charts to gauge performance
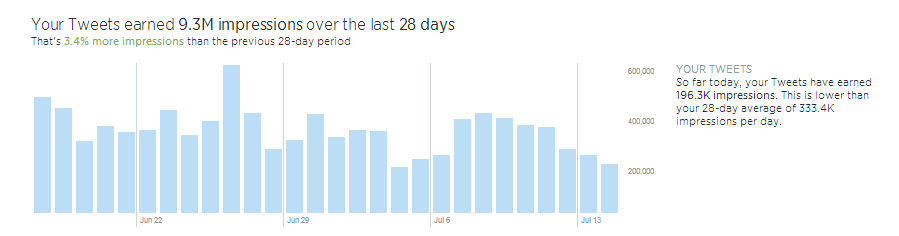
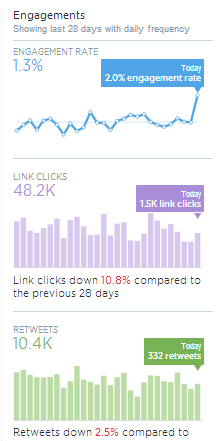
Image Source: HubSpot
We are not the only ones who go gaga over data visualization. Twitter’s new analytics dashboard uses charts extensively to help you understand your metrics better.
3. Drill-down functionality
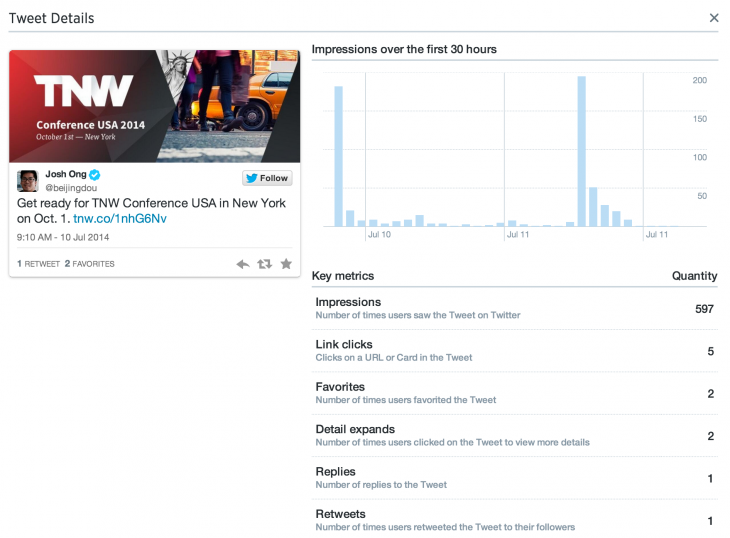
Image Source: TheNextWeb
You can drill-down into the details of each tweet by clicking on them. Each tweet detail page displays metrics like Impressions, Link Clicks, Favorites, Detail expands, Replies, Retweets, and more.
Related article: Check out how FusionCharts Suite XT supports drill-down in its charts
4. Export Functionality
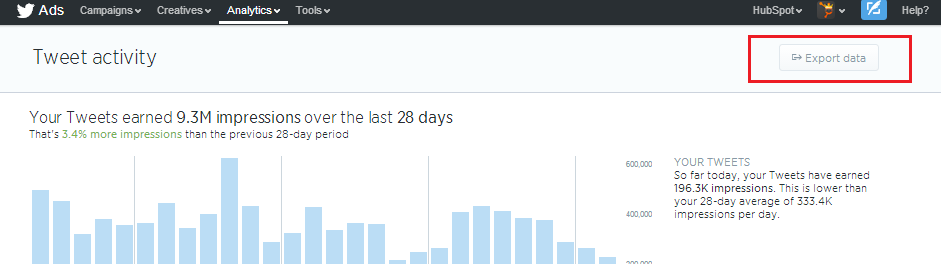
Image Source: HubSpot
You can export tweet performance metrics into a CSV file, including data from both organic and promoted tweets.
Related article: Check out how FusionCharts SuiteXT supports export in multiple formats
With this new dashboard, you can find answers to the when, how, what of your Twitter marketing. For example, you can find out when the best time to tweet is, how embedded media performs in your tweets and what calls-to-action works best for you audience.
Now over to you. What do you think of this new dashboard? Will you trade your third party Twitter monitoring app for Twitter’s in-built dashboard using JavaScript Graph?
Recommended articles:
How Twitter uses data visualization to track its complex workflows?
 Conceptualizing an effective business dashboard
  The Ten Commandments of Designing an Information Dashboard
  Creating Responsive Dashboards with Interactive Charts and Bootstrap
 Introduction to Collaboration Dashboard
 Cleartrip Tracks Payment Failure in Milliseconds
 Behind the scenes of Server Density’s dashboard design
 Twitter’s New Analytics Dashboard


