Rendering Different Charts
In the Getting Started section, we discussed building a single series chart using FusionCharts Suite XT. In this section, you can see how to create different charts and maps using FusionCharts and Blazor.
Note that some of the chart types and the maps use data structures different from the ones you use in a single-series chart. Those are highlighted in the sections below:
Pie 2D Chart
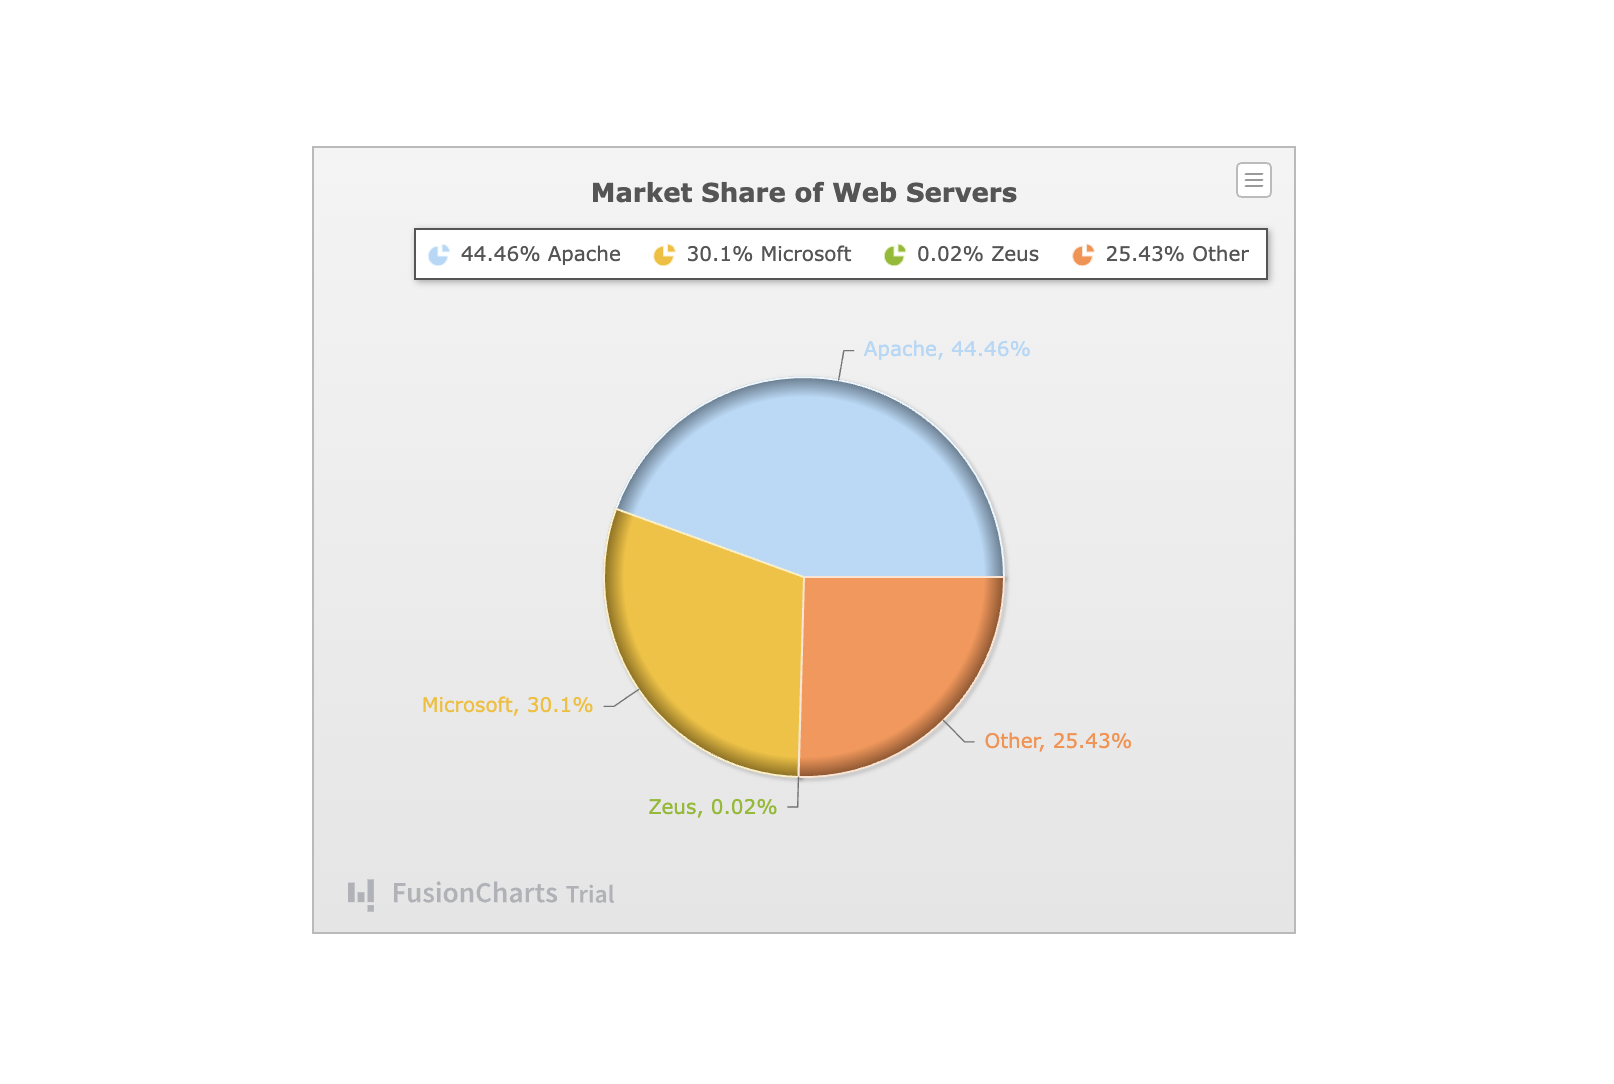
A Pie chart is a circular data visualization tool representing data as pie slices. Each slice corresponds to a category or data point, with its size proportionate to the value it represents relative to the whole. Pie charts are effective for displaying data distribution across categories or illustrating the contributions of different parts to a whole, often using color coding and labels for clarity.
Pie charts are frequently used for showcasing percentages, budget allocations, or market share. Below is an example of a Pie 2D chart.

The following table shows the data used to build the charts shown above.
| Web Server | Revenue |
|---|---|
| Apache | 32647479 |
| Microsoft | 22100932 |
| Zeus | 14376 |
| Nginx | 18674221 |
The data above shows plot points for each web server with corresponding data values to its revenues.
The data in the JSON format for the above chart looks as follows:
// Define the categories representing the labels
const categories = [
{
"category": [
{ "label": "Apache" },
{ "label": "Microsoft" },
{ "label": "Zeus" },
{ "label": "Nginx" }
]
}
]
// Construct the dataset
const dataset = [
{
"seriesname": "Revenue",
"data": [
{ "value": "32647479" },
{ "value": "22100932" },
{ "value": "14376" },
{ "value": "18674221" }
]
}
]
Now that the data is ready let us dive in directly to render the chart.
For this example, let's use the "examples" directory. Copy the full code here from this file.
The consolidated code is given below:
dynamic myChartConfig = new System.Dynamic.ExpandoObject();
dynamic myDataSource = new System.Dynamic.ExpandoObject();
dynamic myChart = new System.Dynamic.ExpandoObject();
myChartConfig.type = "pie2d";
myChartConfig.width = "100%";
myChartConfig.height = "100%";
myChartConfig.dataFormat = "json";
myChartConfig.renderAt = "demoID";
myChartConfig.id = "1";
myChart.caption = "Market Share of Web Servers";
myChart.defaultCenterLabel = "Total revenue: $64.08K";
myChart.centerLabel = "Revenue from $label: $value";
myChart.centerLabelBold = "1";
myChart.ready = "readyCallback";
myChart.exportEnabled = "1";
myChart.plottooltext = " <b>$percentValue</b> of web servers run on $label servers";
myChart.showlegend = "1";
myChart.showpercentvalues = "1";
myChart.usedataplotcolorforlabels = "1";
myChart.legendposition = "top-right";
myChart.theme = "candy";
myDataSource.data = new[] {
new { label = "Apache", value = "32647479" },
new { label = "Microsoft", value = "22100932" },
new { label = "Zeus", value = "14376" },
new { label = "Nginx", value = "18674221" },
};
myDataSource.chart = myChart;
myChartConfig.dataSource = myDataSource;
String chartConfig =
System.Text.Json.JsonSerializer.Serialize(myChartConfig);
await fusionChartsService.renderChart(chartConfig);Time-Series Chart
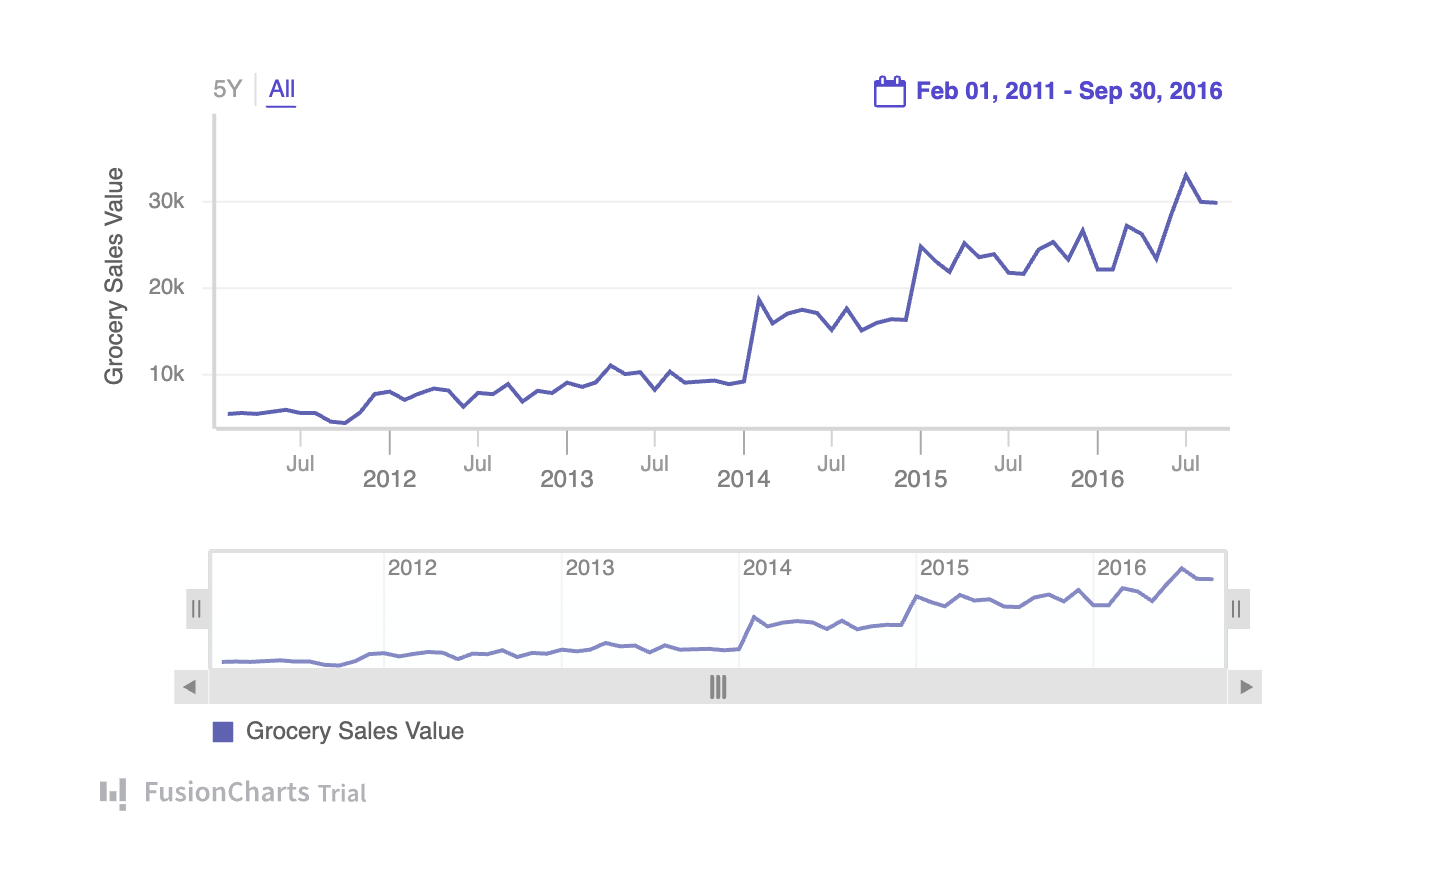
Now, let’s look at how to render a time-series chart. The time-series chart can deal with very large sets of data. In this example, the data and schema(structure) of the data are available as external JSON files. The method setDataStore is invoked to create a new data store using the data and schema provided, thereby rendering a FusionCharts time series chart.

The consolidated code for rendering the chart is given below:
private async Task renderTimeCharts()
{
dynamic myChartConfig = new System.Dynamic.ExpandoObject();
dynamic myDataSource = new System.Dynamic.ExpandoObject();
dynamic myChart = new System.Dynamic.ExpandoObject();
dynamic myEvent = new System.Dynamic.ExpandoObject();
dynamic myColorRange = new System.Dynamic.ExpandoObject();
myChartConfig.type = "timeseries";
myChartConfig.width = "600";
myChartConfig.height = "400";
myChartConfig.dataFormat = "json";
myChartConfig.renderAt = "chartContainer1";
myChartConfig.id = "chartId";
myChartConfig.caption = "Sales Analysis";
myChartConfig.subcaption = "grocery";
myChartConfig.yAxisName = "asdf";
myDataSource.data = new { };
myDataSource.chart = myChart;
myDataSource.events = myEvent;
myDataSource.colorRange = myColorRange;
myChartConfig.dataSource = myDataSource;
String chartConfig = System.Text.Json.JsonSerializer.Serialize(myChartConfig);
await fusionChartsService.renderChart(chartConfig);
<!--Add data.json and schema.json files in wwwroot folder and add their respective paths here-->
String dataFilePath = "./data-time-series.json";
String schemeFilePath = "./schema.json";
String dataContent = File.ReadAllText(dataFilePath);
String schemaContent = File.ReadAllText(schemeFilePath);
<!--use setDataStore method to load the data table which takes data and schema as input-->
await fusionChartsService.setDataStore("chartId", dataContent, schemaContent);
}Maps
FusionMaps XT offers interactive maps that allow you to plot geographical data, such as revenue by region, population by state, survey, and election results. The example below shows how to render Maps using the Blazor application.
The example here demonstrates the Growth of the Population World Wide. The JSON data is provided from the external file as the relative path and then converted to an absolute URL. It finally invokes the generic method to call the setJSONUrl method with the URL of the data as an argument for effectively setting the data source to the chart.
The data in the JSON format for rendering a map looks as follows:
private async Task renderMap()
{
dynamic myChartConfig = new System.Dynamic.ExpandoObject();
dynamic myEvent = new System.Dynamic.ExpandoObject();
dynamic myData = new System.Dynamic.ExpandoObject();
myChartConfig.dataFormat = "json";
myChartConfig.renderAt = "chartContainer1";
myChartConfig.type = "world";
myChartConfig.width = "100%";
myChartConfig.height = "100%";
myChartConfig.id = "testyr";
myEvent.entityClick = "function(){console.log('clicked')}";
myEvent.entityRollover = "function(){console.log('entityRollover.......')}";
myChartConfig.events = myEvent;
myChartConfig.dataSource = myData;
String chartConfig = System.Text.Json.JsonSerializer.Serialize(myChartConfig);
await fusionChartsService.renderChart(chartConfig);
var FilePath = "data.json";
var Url = NavigationManager.ToAbsoluteUri(FilePath).ToString();
await fusionChartsService.CallFusionChartsFunction("setJSONUrl", "testyr", Url);
}