FusionCharts vs Highcharts: Which tool is best for rendering charts on websites?
FusionCharts and Highcharts are two of the most recognized charting libraries in the dev. But if you're building enterprise-ready, modern, data-rich dashboards, especially those that scale with time-series, real-time updates, and granular visual control, FusionCharts gives you more out of the box.

Why choose FusionCharts over Highcharts?

Built for real dashboards
Build highly customizable and dynamic dashboards with ease.
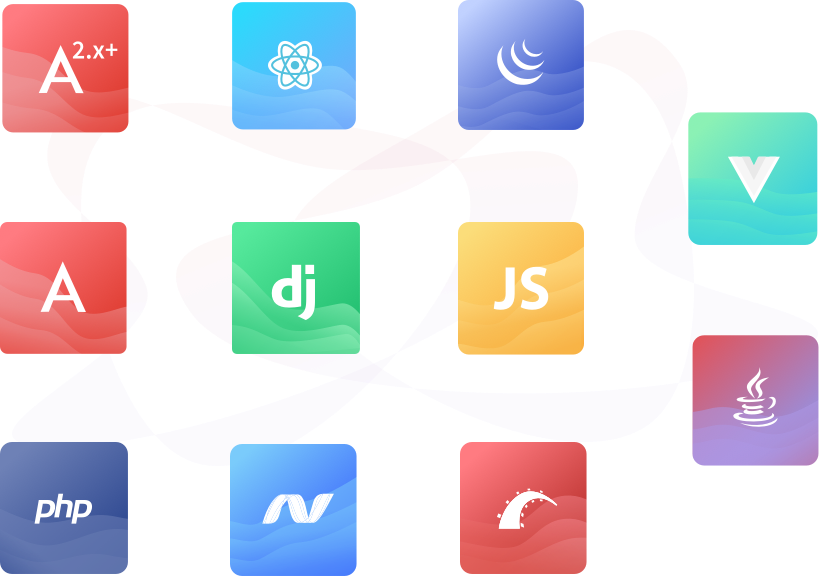
Developer-friendly integrations
From React, Angular, Vue to .NET and Java. FusionCharts offers plug-and-play components with full documentation, reducing dev time significantly.
Performance at scale
FusionCharts handles large datasets and complex drill-down charts effortlessly with minimal configuration which makes it enterprise-ready.
Here is how FusionCharts outperforms HighCharts!
Intelligent configurations to reduce your workload
Developers love FusionCharts! (Check below to see how much!) Because it works! Did you set numbers in a string format? No worries, we'll convert them automatically. Too much data sent to the charts? Never mind, we'll manage the components smartly so that you don't have to deal with those stinky edge cases. FusionCharts has many such default functions to help build your dashboards efficiently.
Official plugins for back-end and front-end for better integration
Apart from providing official integrations for popular frameworks like React, Angular, and Vue.js, we also offer integrations for Ember to Java and jQuery to Rails so that you can integrate FusionCharts into your project smoothly.
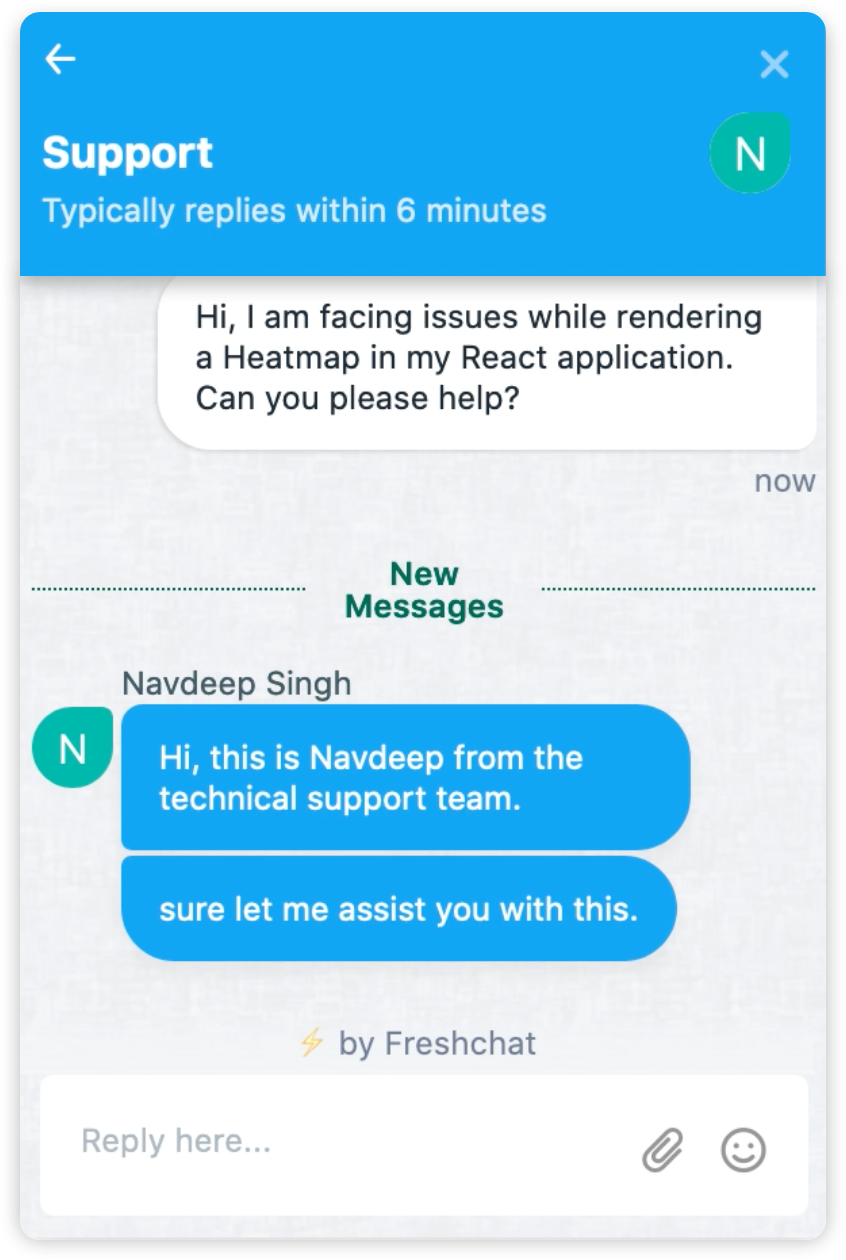
Why wait for days when you can get answers in minutes with live chat
Your time is precious. Don't wait for days on end to get your queries resolved. Our experts on the live chat get you all the answers in literally a few minutes. Keep your project on track for that release!
Extensive documentation to help build your dashboards in a jiffy
We understand that extensive API documentation is key. API references and demos just don't cut it, especially when you're chasing against time to finish that sprint. We have extensive tutorials on all our charts for the framework of your choice. Yes, you read that right! From React to .NET, we have tutorials for every framework.
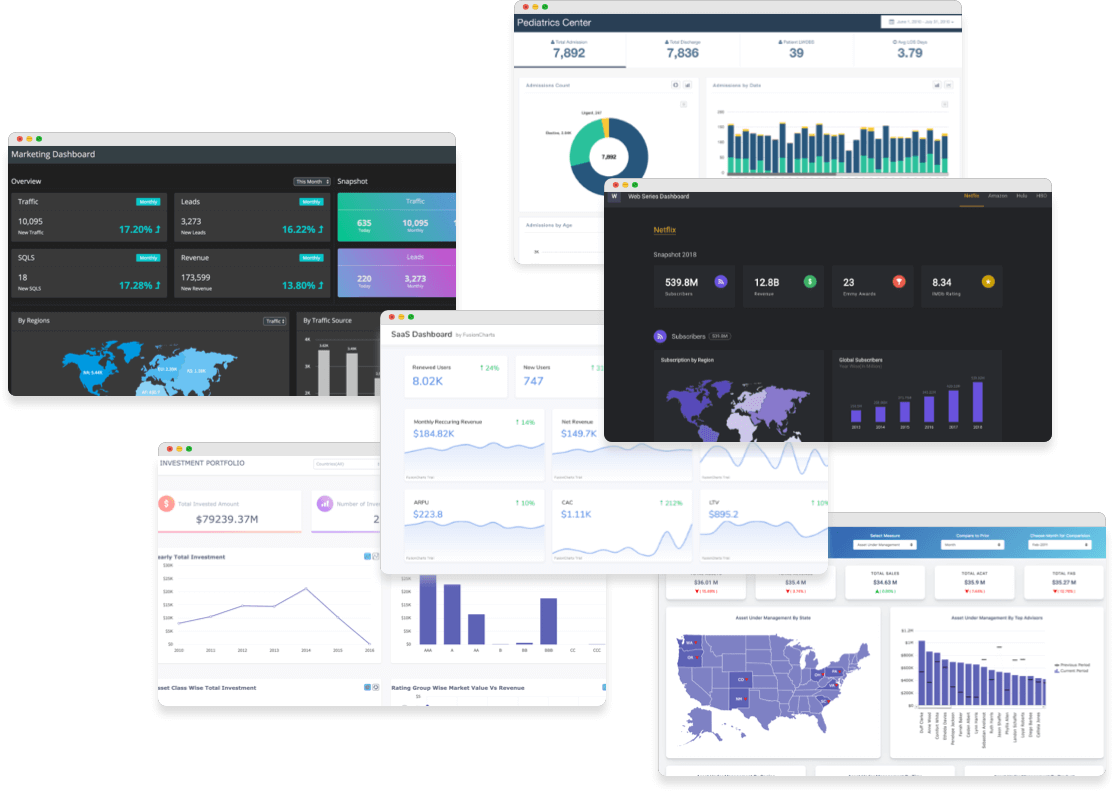
Free live examples for inspiration
We provide over 20 live dashboards with source code. This will not only serve as an inspiration to build amazing dashboards, but also helps to plan your architecture accordingly.
FusionCharts vs Highcharts: Feature Comparison
| Feature | FusionCharts | Highcharts | What This Means for You |
|---|---|---|---|
| Chart capabilities | 100+ charts, widgets, gauges, 2000+ maps, real-time & domain-specific charts | Core charts, with advanced types available via add-ons | Build anything from KPI dashboards to complex data systems |
| Framework support | Native plugins for React, Vue, Angular, jQuery, Java, .NET | Limited official integrations | Integrate seamlessly into your tech stack |
| Dashboard readiness | Built-in support for FusionTime, FusionExport, FusionMaps | Basic charting, real-time and Gantt via separate modules | No need to stitch together extra libraries |
| Design flexibility | Highly customizable themes, annotations, tooltips, interactivity | Themeable, but requires manual config | Match charts with your brand and UX goals effortlessly |
| Performance & speed | Handles large datasets with streaming updates, animations, and smart loading | Optimized, but may lag on real-time or high-volume data | Confidently scale to enterprise-level data without lags |
| Exporting | One-click export, CLI tool (FusionExport), PDF/PNG/SVG support | Built-in export to PNG/JPEG/SVG | Easier report generation at scale |
| Learning curve | Developer-first docs, live examples, community Slack, email + chat support | Good docs, slower onboarding without live examples | Get started quickly and get help when stuck |
| Pricing | Transparent plans from $499/year with all features included | Starts at ~$176/year but advanced features cost extra | No hidden fees or fragmented licensing |