
Why choose FusionCharts over Google Charts?
 | ||
|---|---|---|
| Column & Bar | ||
| Line & Area | ||
| Pie & Donut | ||
| Stacked Charts | ||
| Combination / Mixed Charts | ||
| Bubble and Scatter Charts | ||
| Market Share / Marimekko Charts | ||
| Pareto Charts | ||
| Gauges, KPIs & Widgets | ||
| Gantt | ||
| Funnel & Pyramid | ||
| Bullet & Sparkline | (Image Only) | |
| Realtime Charts | ||
| Heat & Treemaps | ||
| Radar / Spider Charts | ||
| Waterfall / Cascade Charts | ||
| Node Diagram | ||
| Statistical Charts | ||
| Stock Charts | ||
| Sankey | ||
| Sunburst | ||
| Chord | ||
| Chorpleth Maps | ||
| 3D Charts | ||
| Box & Whisker | (Image Only) |
Blends in perfectly with your tech stack
From giving backward compatibility, having official plugins, to a stable roadmap, FusionCharts has always been a developer-first product. Which is why we support all the popular frameworks from the good ‘ol jQuery to the most modern Svelte and .NET to Ruby on Rails.
In-depth documentation with ES6 examples to build your dashboards quickly
FusionCharts documentation not only offers API references but also easy-to-follow tutorials for every chart and configuration. These tutorials also support ES6 conventions—you can implement them in your project right away with certainty. And the best part? All these tutorials are present in over 10+ frameworks and languages such as React, Vue, Svelte, Ruby on Rails, Django, etc.
Customize every interaction and feature to your needs
| ||
|---|---|---|
| Drilldown Charts | ||
| Region Selection | Only for scatter and Zoom charts | |
| Panning | ||
| Zooming and Scrolling | ||
| Drag | ||
| Crosshair | ||
| Label Links | ||
| Interactive Legends | ||
| Legend Customization | ||
| Informative Tooltip | ||
| Customization of Tooltip | ||
| Trendlines | ||
| Regression Lines | ||
| Number Formatting | ||
| Glass Effect on Plots | ||
| Intelligent Label Management | ||
| Live Data | ||
| Animation API | ||
| Input data format | JSON, XML | CSV, JSON |
| Logarithmic | ||
| Inverse Axis | ||
| Smart Plot Colouring | ||
| Annotations | ||
| Annotation Macros | ||
| Themes | ||
| Custom Themes | ||
| Events | 150+ | |
| External Logo | ||
| Additional Drawing tools(on chart) | Only CSV, HTML table | |
| Mobile Responsiveness | (Automatically adapts to screen size) | |
| Section 508 & Accessibility |
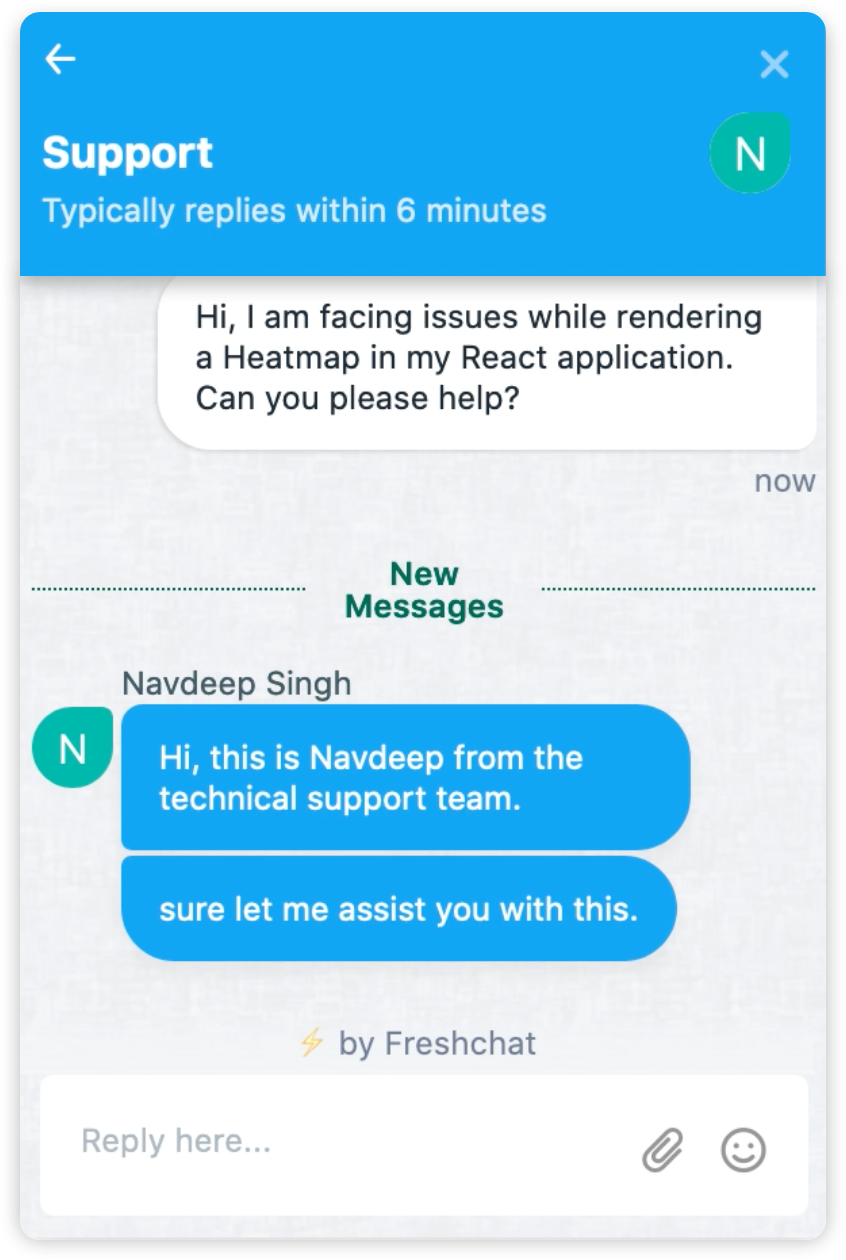
Your issues resolved in minutes!
We offer support via email, live chat, and our forum. You can get help in a few minutes unlike waiting for replies on GitHub for days.
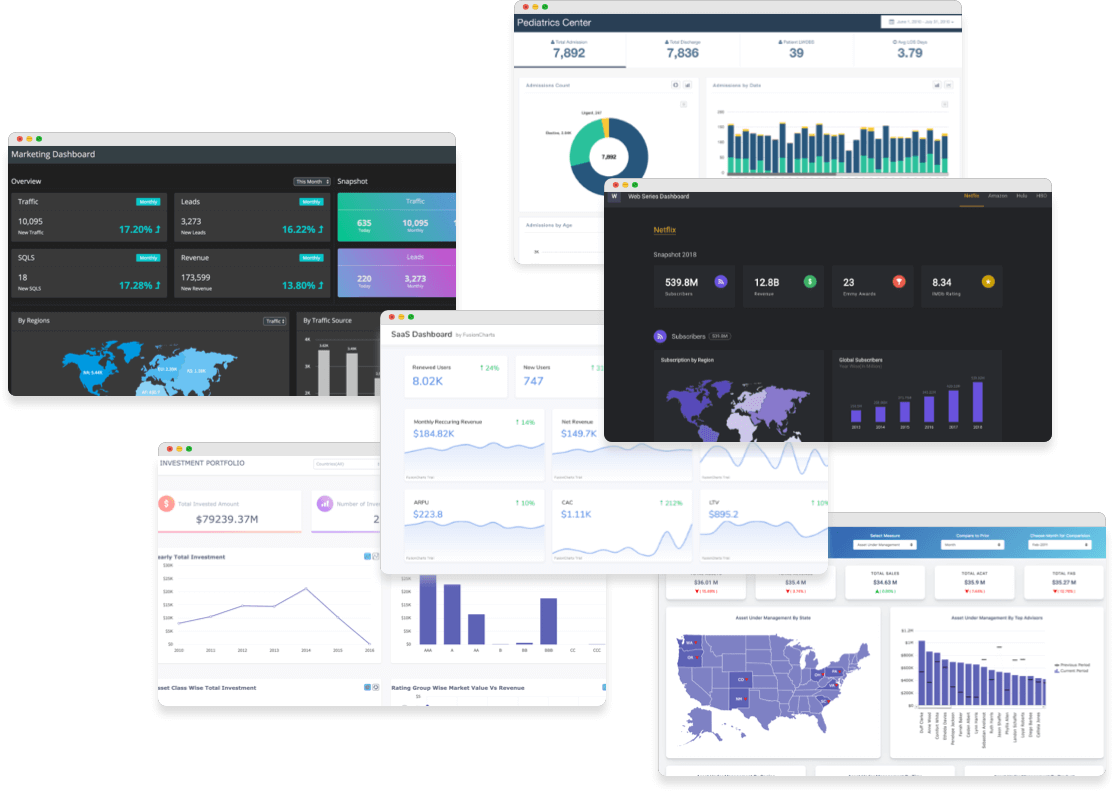
Free live examples in the choice of your framework for inspiration
We provide over 20 live dashboards with source code, which will serve as an inspiration to build amazing dashboards and plan your architecture accordingly.
Listen to events for every single interaction and component
| ||
|---|---|---|
| Lifecycle Eventss | ||
| Plot Events | ||
| Data Events | ||
| Chart Events | ||
| Mouse Events | ||
| Interactions (Zoom, Drag, Scroll) | ||
| Chart Labels Events | ||
| Axis Events | ||
| Annotations Events | ||
| Plot Events | ||
| Legend Events | ||
| Slicing Events | ||
| Error Handling Events |

Export the entire dashboard, not just a single chart on your server
Planning to send dashboards via email or allow them to export in PDF or simply generate charts on the server? Use FusionExport to export the entire dashboard to PDF, PNG. etc. Oh, it comes with SDKs for C#, Java, Python, Node.js, and PHP. No biggie!
Save time with intelligent configurations and better APIs


Don't just take our word! Look what our customers are saying
Thank you for all your help!! This is what I call GREAT customer service. I am very glad Dell decided to purchase this product as your help has made it worth every penny.
Ryan Jeffords,
This is a great application, it saves a lot of time and although I would like to say the 'Wow' factor is because of the great data I provide; I know that it is more likely due to the presentation that FusionCharts has made possible.
Jonathan Rickard,
Best money I have ever spent on a useful piece of application software. Ideal for the management reporting that Electric Penguin delivers to its clients.
Paul Smith,
FusionCharts and [Fusion]Maps offered us a clean and dynamic way of displaying information on our site. We used a combination of drill-down maps and charts to create a very interactive model of Native American Service Centers across the US. We could not have done it without Fusion components.
Cherylyn Stoltman,


Ready to get started?
Similar comparisons
FusionCharts vs HighCharts
Over 28,000 companies and 800,000 developers trust FusionCharts for our easy-to-use, highly customizable, and beautiful chart...
HighCharts vs Chart.js
Are you trying to figure out the differences between HighCharts and Chart.js? Read on to choose the best based on your prefer...
Google Charts vs Chart.js
Is Google everything always the best? This page lays out the comparison of Google Charts against Chart.js based on several pa...
Google Charts vs HighCharts
Google Charts has a great basic chart gallery, but lacks advanced charts and features your business needs to build that perfe...


Disclaimer: FusionCharts logo is property of FusionCharts. Google Charts logo is property of Google Charts.