Venture Financing Dashboard
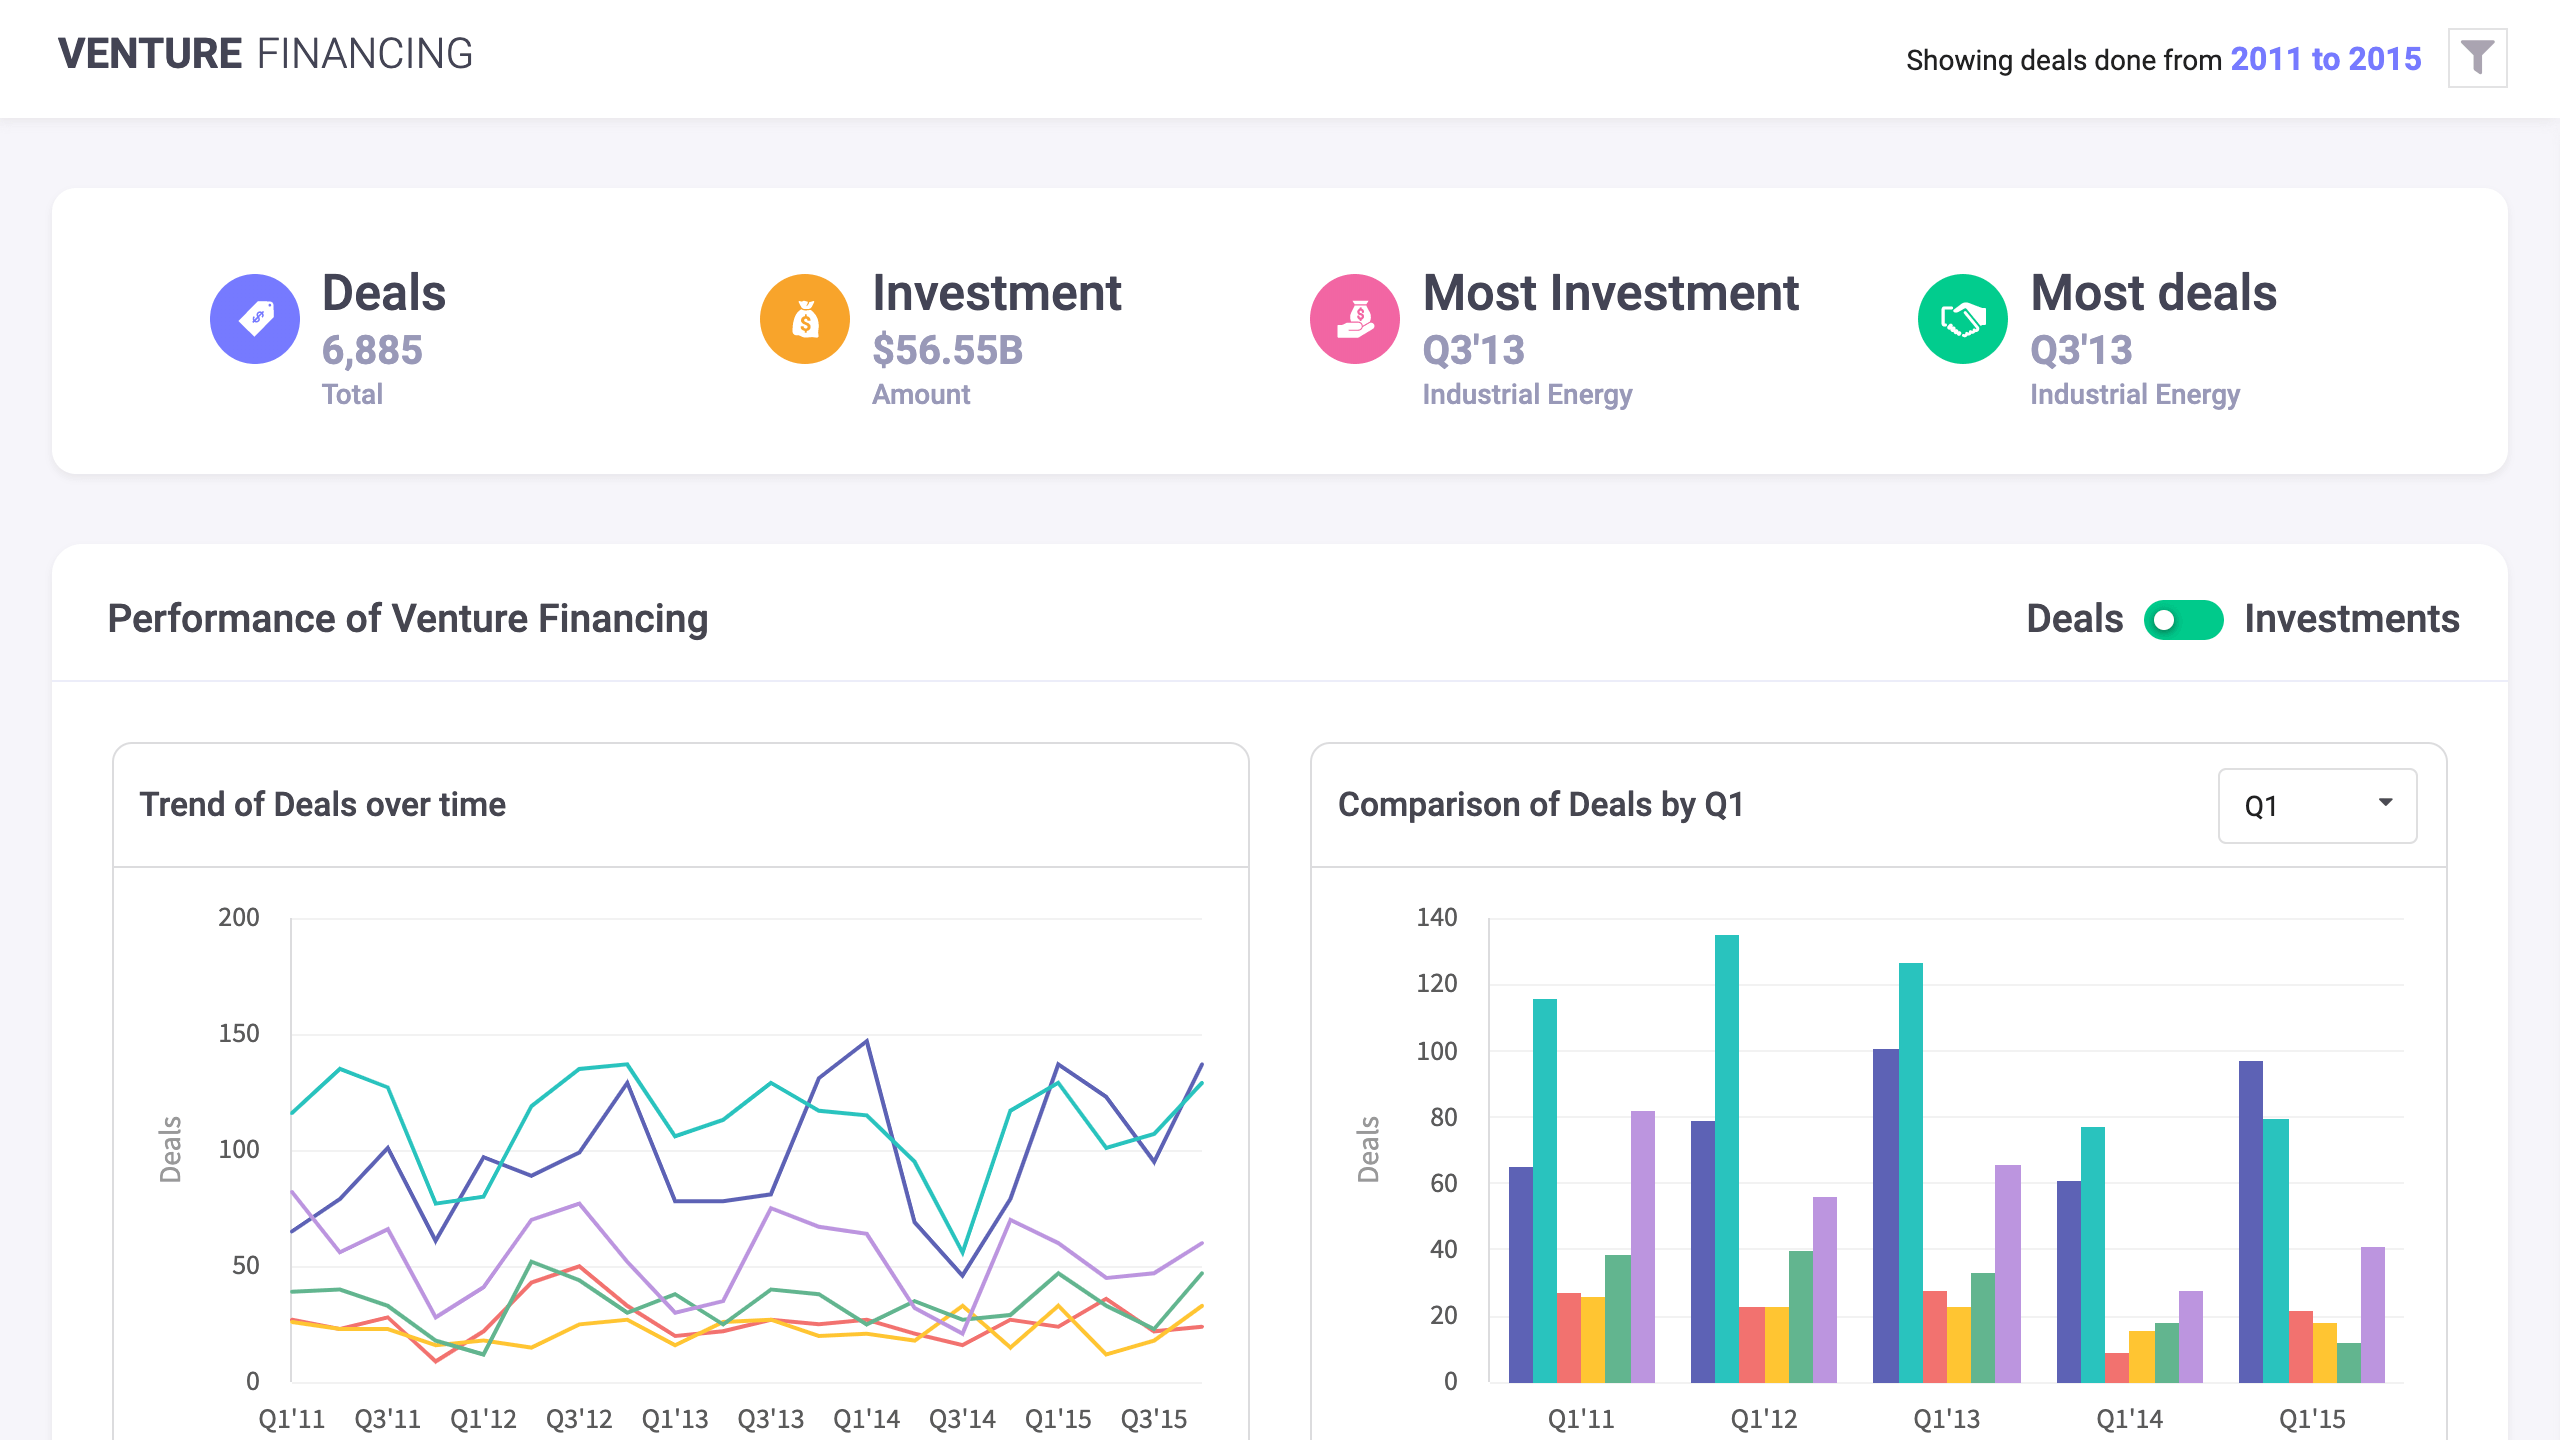
This dashboard allows you to see the trends in venture financing. It depicts the overall summary of the deals and investments in various sectors and compares them over a period of time. The dashboard also shows sector-wise trends, both quarterly and yearly within a selected timeframe. It also lists down the best quarter in terms of deals and investments. The dashboard helps in identifying any patterns/anomalies in the investments thereby aiding you to make an informed decision.
This sample dashboard is built using FusionCharts Suite XT, which needs a license for commercial use.
Key features
- Track deals and investments on quarterly/yearly basis
- Filter the trends based on your desired sectors
- Analyze the trends within a custom adjustable timespan
- Get an overview of quarterly average Deals by sector
FusionCharts products used
Technologies used
How to get started with this dashboard
Environment Setup
- Make sure you have Node JS >= 8.10 and npm >= 5.6
Project Files Setup
- Create a folder and extract the zip
- Navigate to the extracted folder and install the dependencies
npm installornpm i - To start the server
npm run start - Open URL http://localhost:3000/ into browser
Similar Dashboards
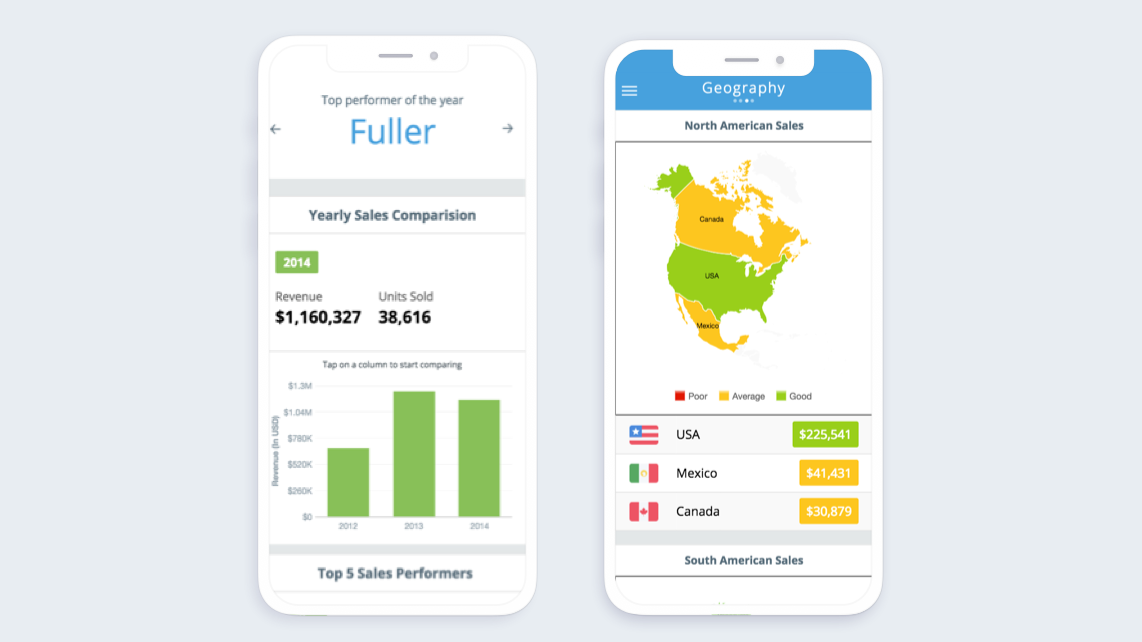
Sales Performance Dashboard
View sales performance on the go with our Mobile Sales Dashboard, using simple column charts for easy understanding and analysis. Quickly sc...
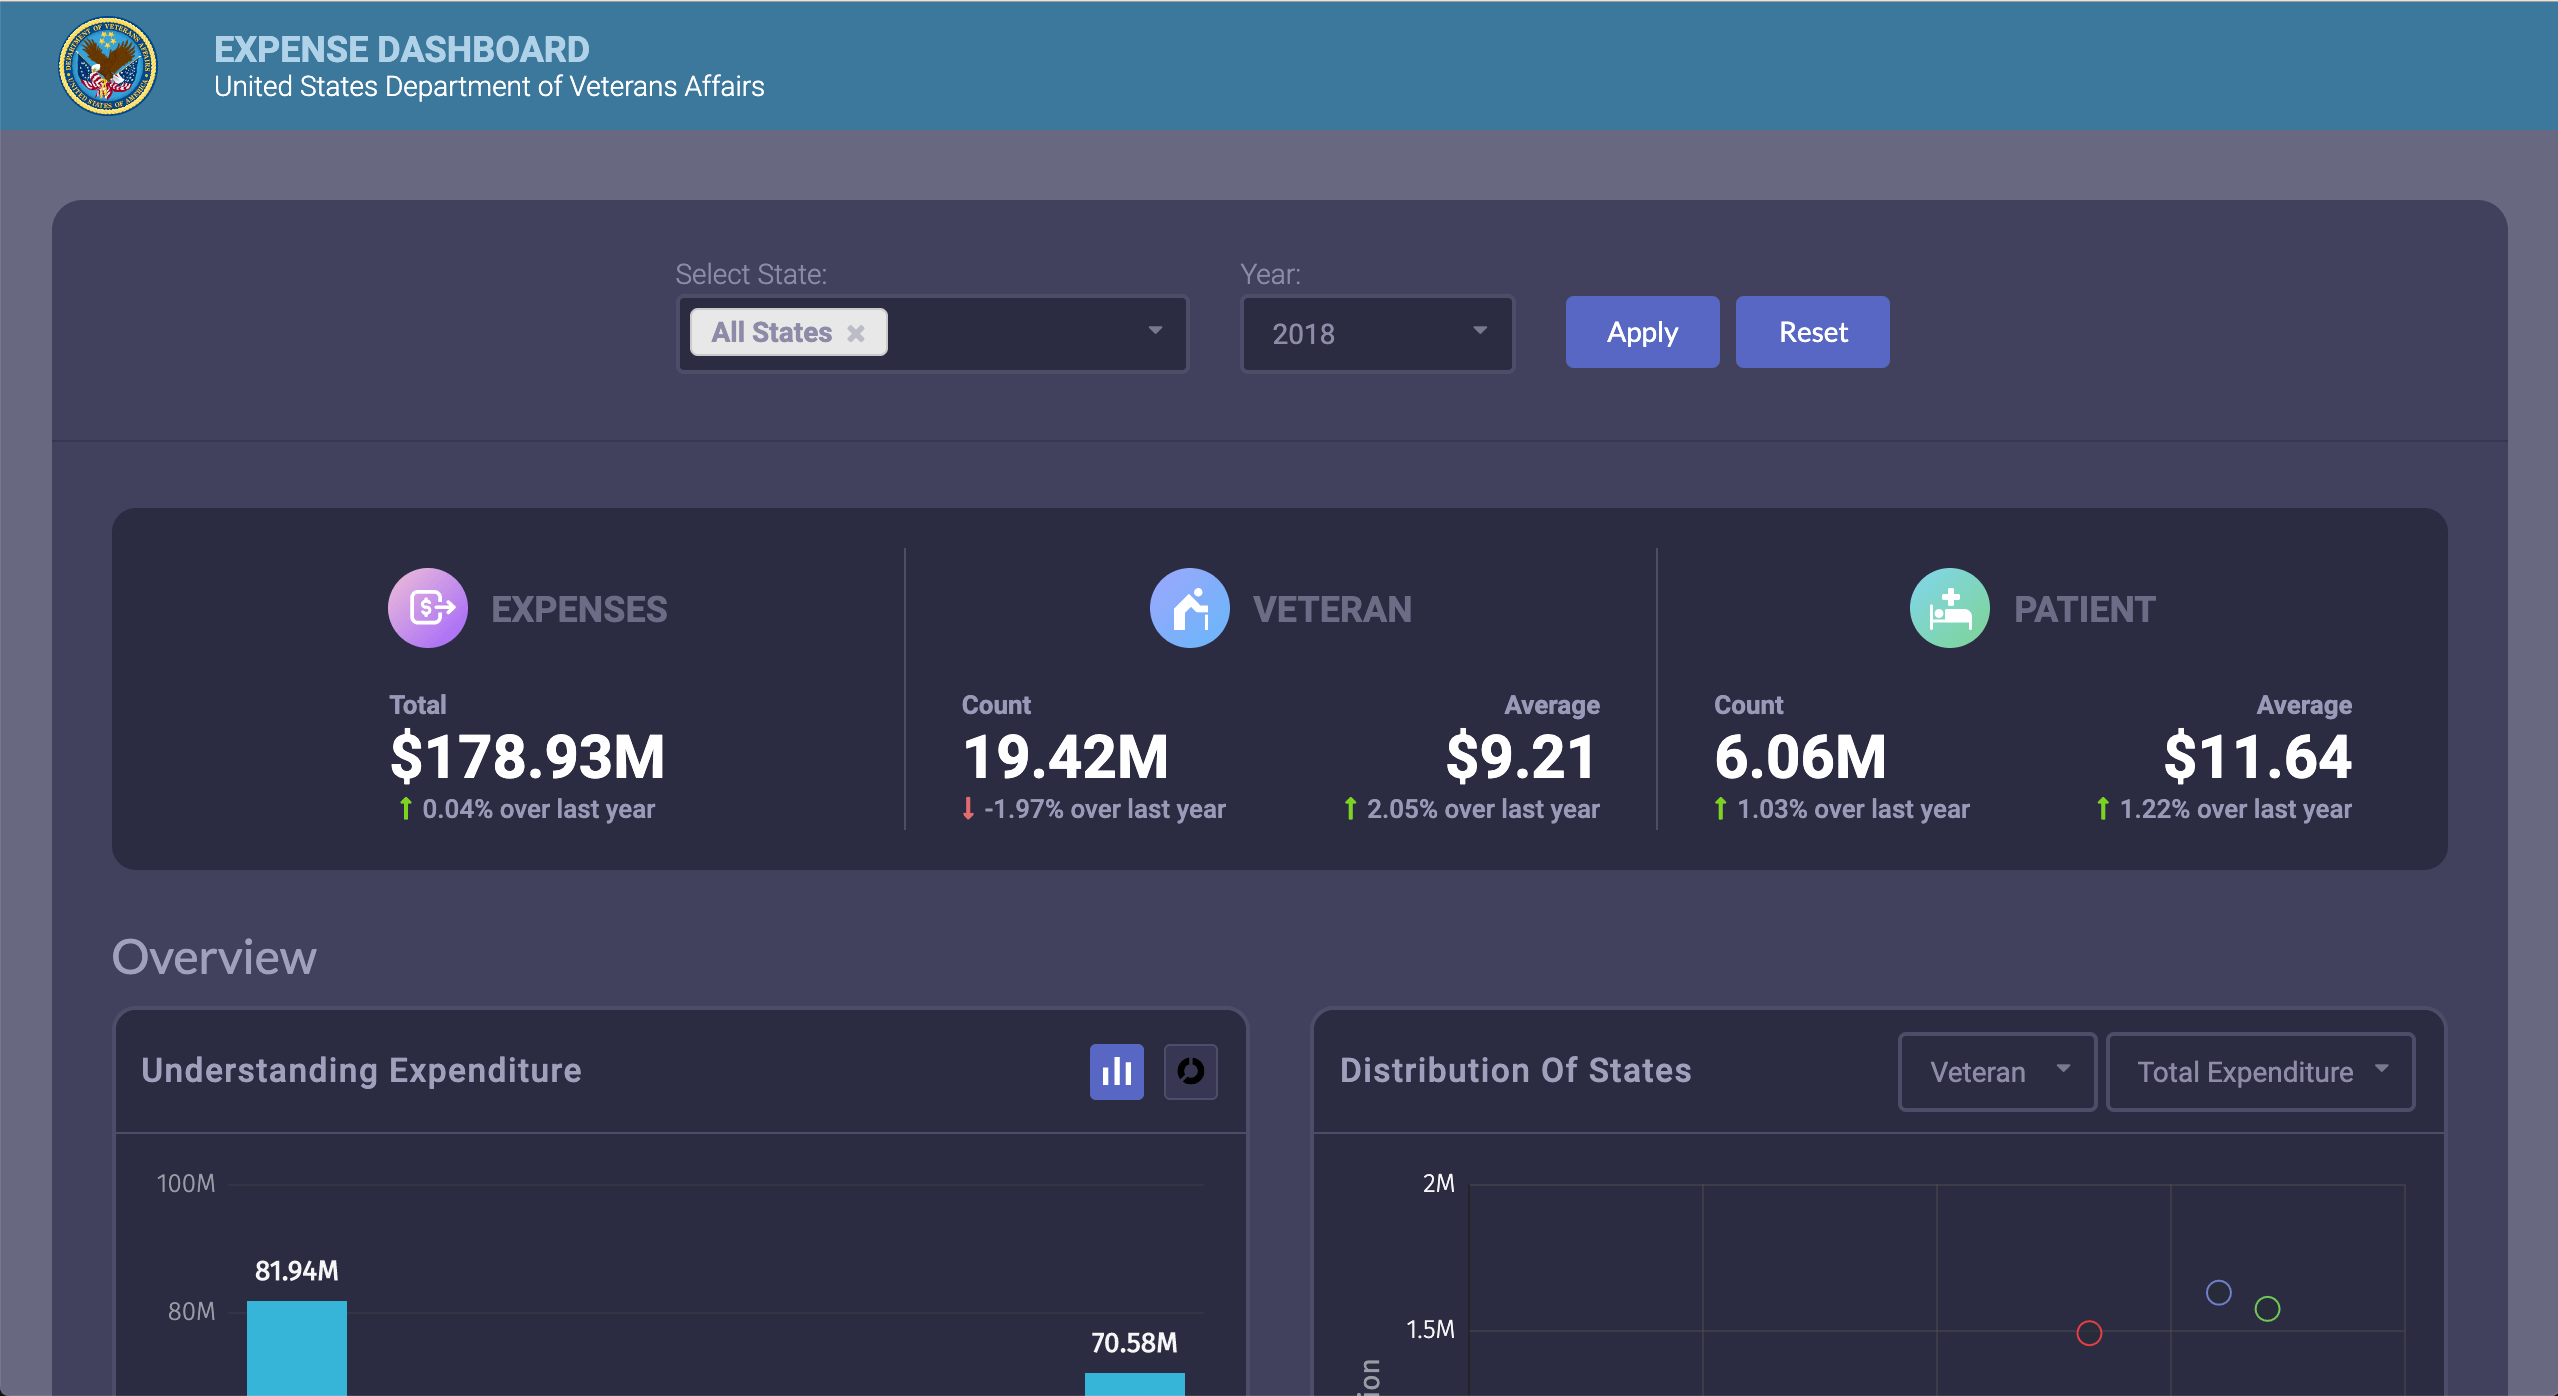
Expense Dashboard of US Dept. of Veteran Affairs
This dashboard gives a single consolidated view of the expense incurred by the United States Department of Veteran Affairs with special focu...
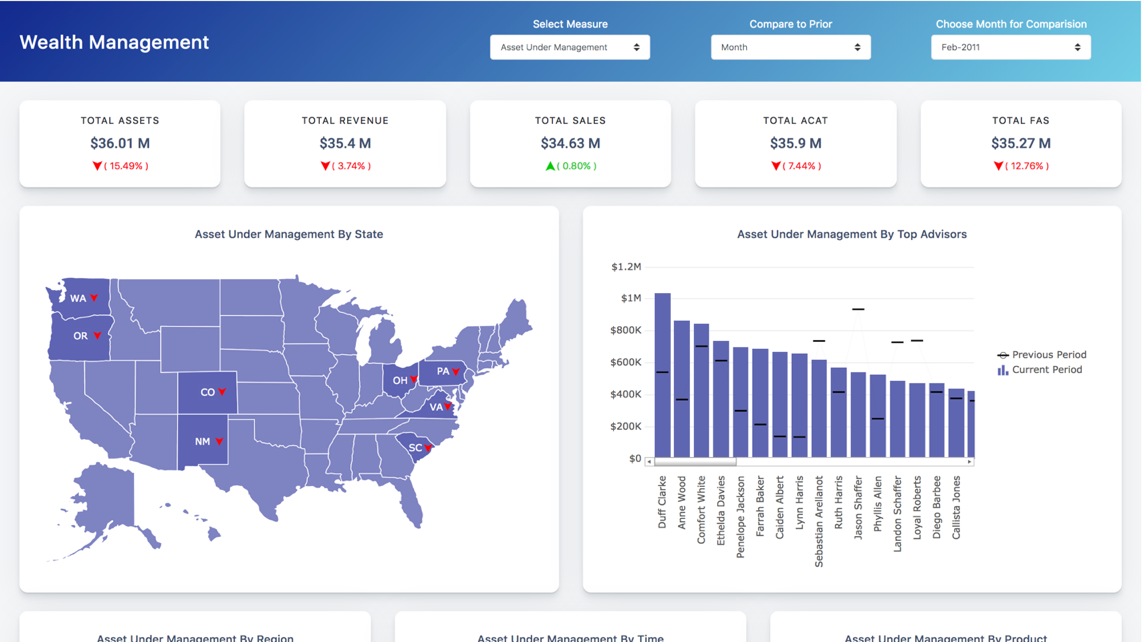
Wealth management dashboard
Manage wealth better by tracking the performance of financial assets. Our wealth management dashboard helps you track the distribution of as...