Performance of Tech IPOs
Data Story by FusionCharts
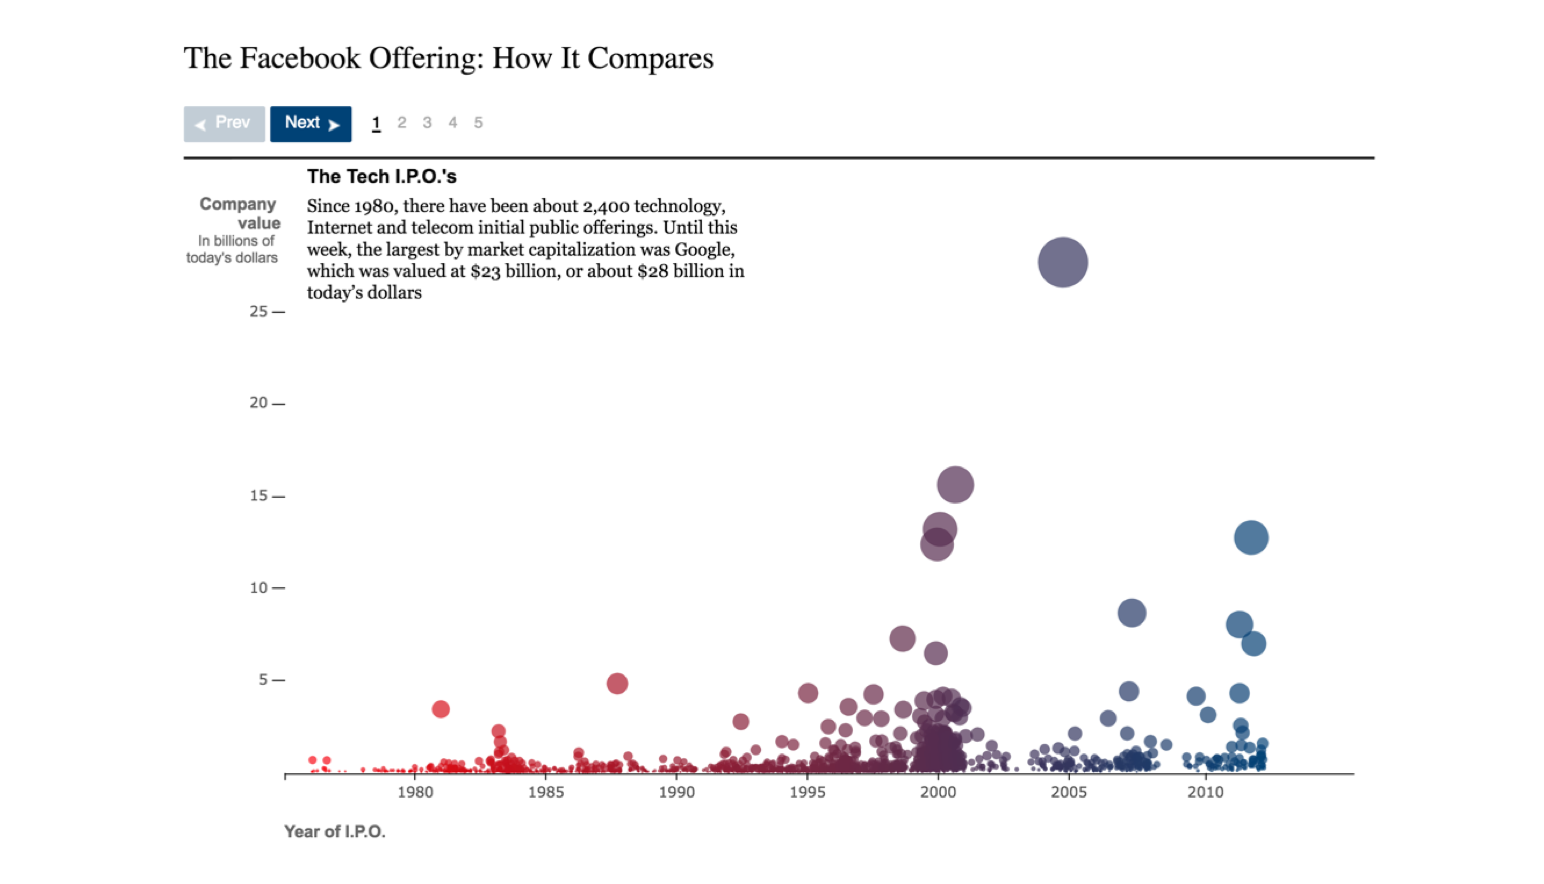
This story gives us a comprehensive understanding of the initial public offerings (IPOs) of technology and internet companies. It shows how in the history of IPOs, first Google and then Facebook set new highs of IPO market capitalization. In fact, the market capitalization on Facebook’s debut day was so much more than other companies, that resorting to a logarithmic axis gives us a better comparison scope. The story goes on to show how market capitalization of other companies surged on their listing day and how they performed three years later.
This sample dashboard is built using FusionCharts Suite XT, which needs a license for commercial use.
Want to use this Data Story in your projects?
We can plug in your data into our data story templates, or customize the template for your needs, or even build a completely new one. We would love to talk to you!