Realty Information Dashboard
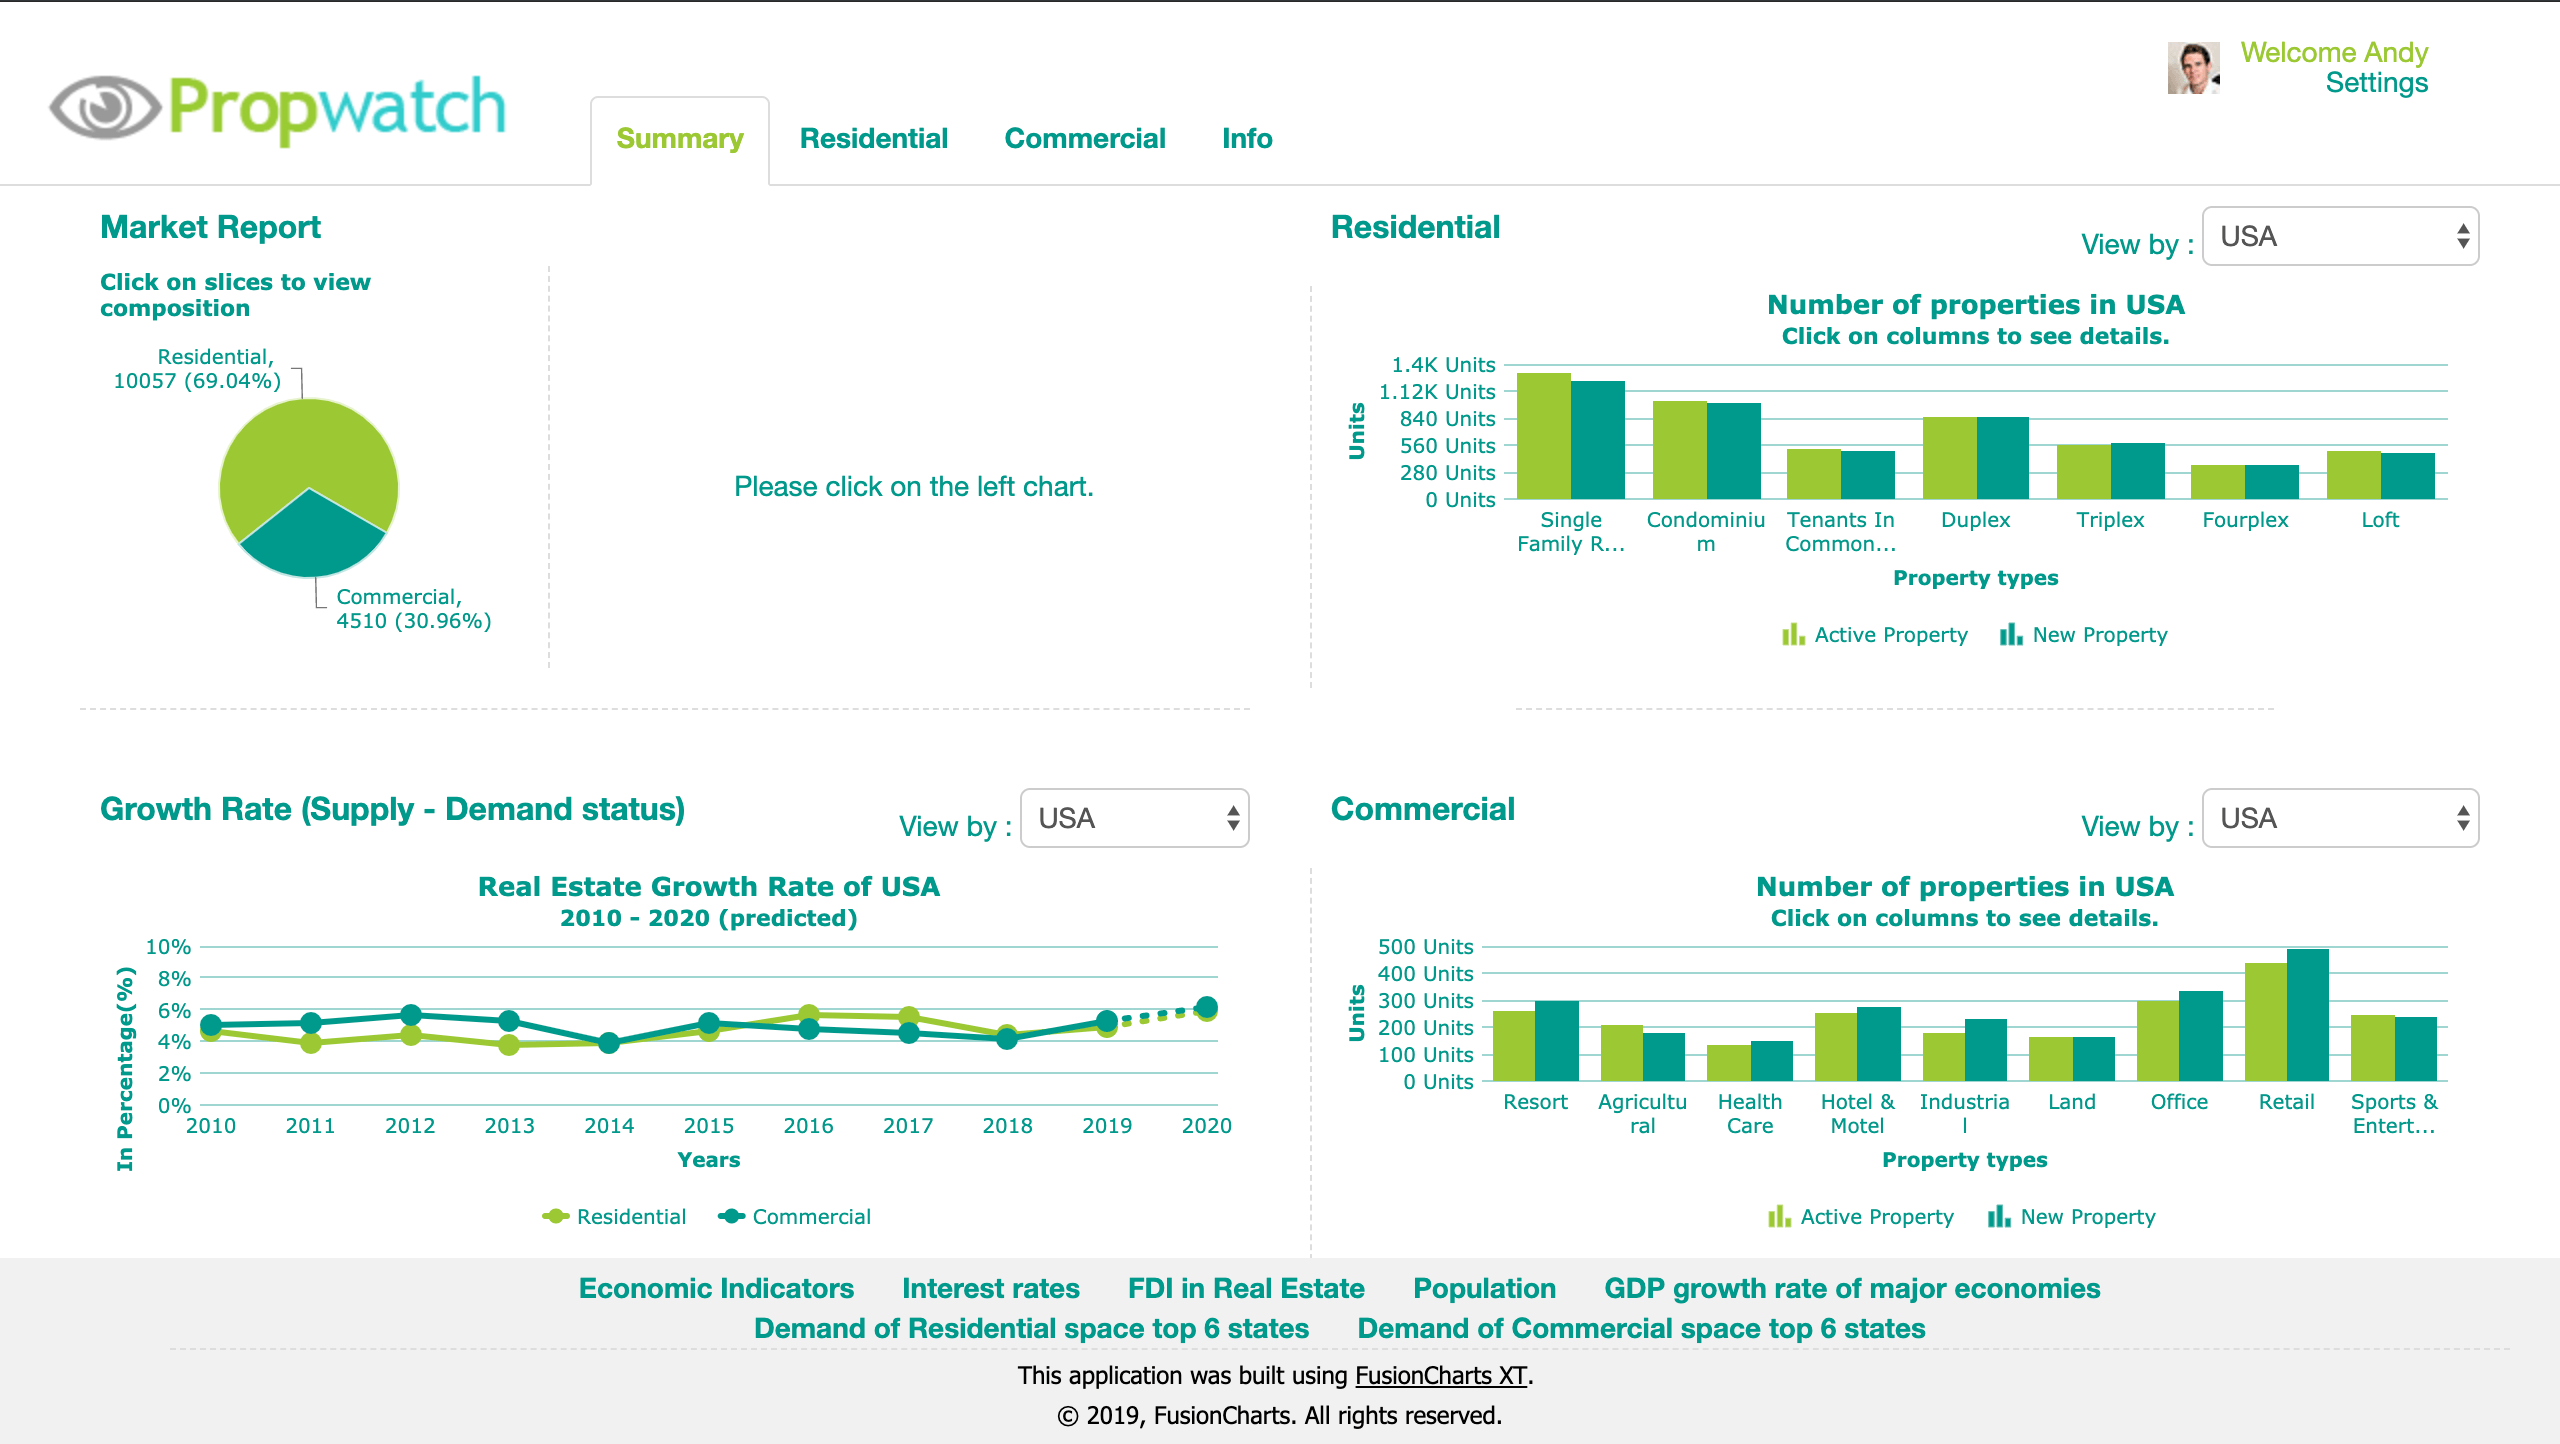
A complete dashboard for anyone in the realty business – brokers, investors, solution developers, and the like – our US Realty Snapshot Dashboard provides detailed information on residential & commercial properties, buying trends, and important fiscal KPIs (population, inflation, GDP, and more) to help draw correlations. Deep-dive into the top 6 states for more data, categorize market share by different sub-types, and more.
This sample dashboard is built using FusionCharts Suite XT, which needs a license for commercial use.
Key features
- Keep an eye on how prominent builders/promoters are doing and simplify decision-making in the highly dynamic property market.
- View an end-to-end narrative, starting with two major property types, then market share as per sub-types, current and predicted trends, and finally a full analysis of each sub-type.
- Understand how year-on-year changes are impacted by external factors, like population, inflation, FDI, GDP, and others.
- Ensure security and control access to data, with a user profile and password-based login system.
- As a developer, you could plug in data from any country and create a fully customized dashboard for your users’ needs.
FusionCharts products used
Similar Dashboards
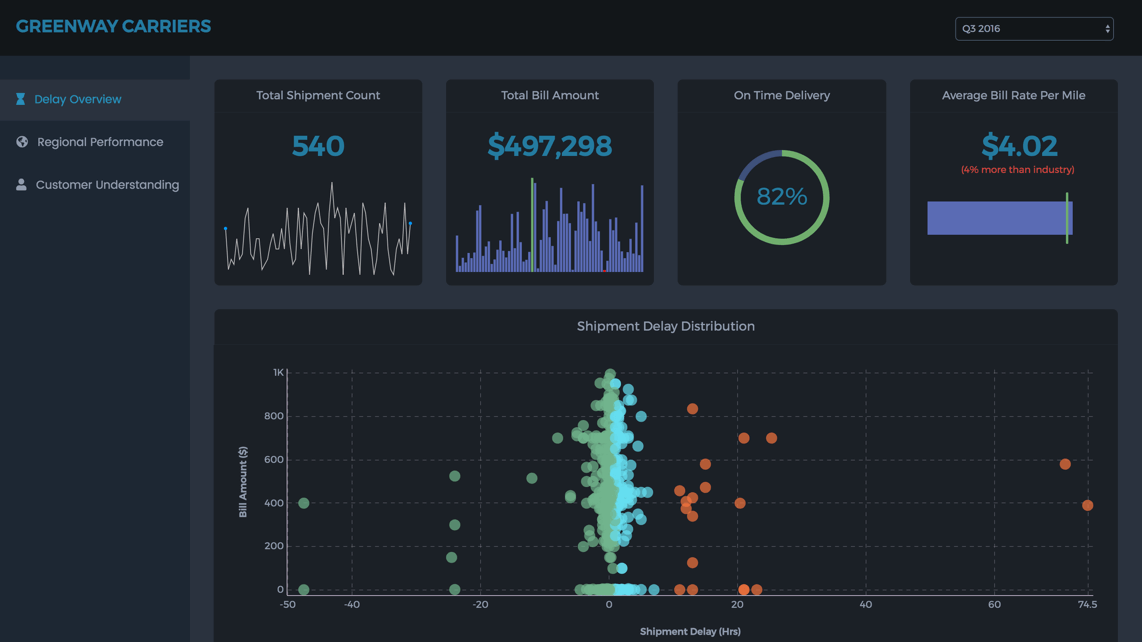
Shipment Analysis Dashboard
Make better decisions by getting a 360° view of your shipment performance. This dashboard can help you monitor, analyze and understand the m...
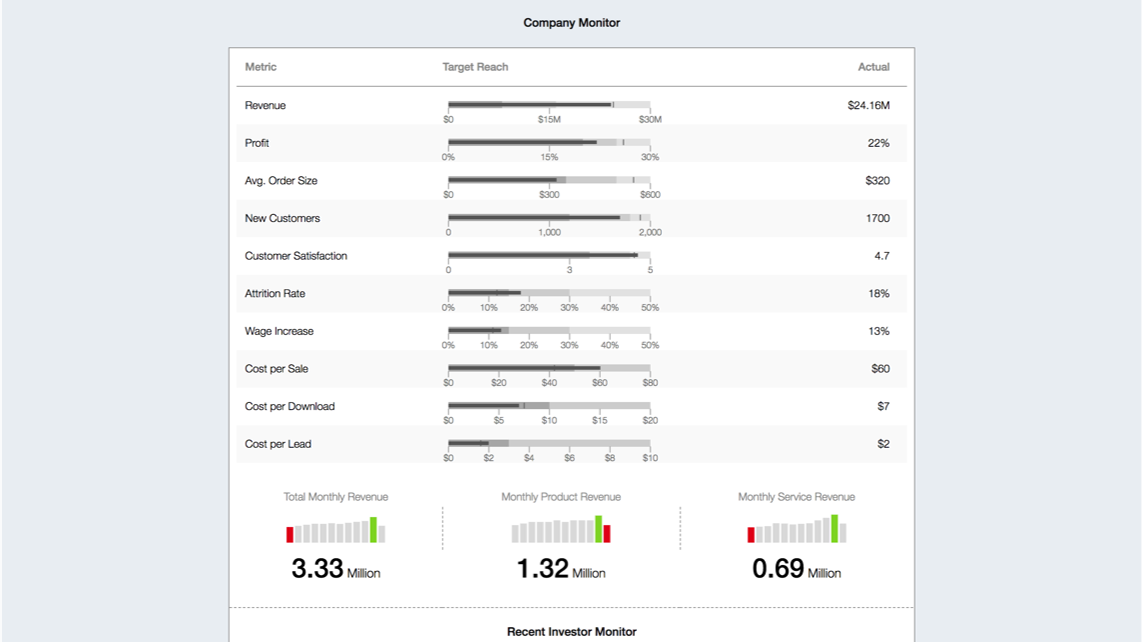
Business Operation Monitoring Dashboard
Track intra-organizational KPIs, monitor functional metrics (sales, marketing, HR, and more), and trump competition using competitor metrics...
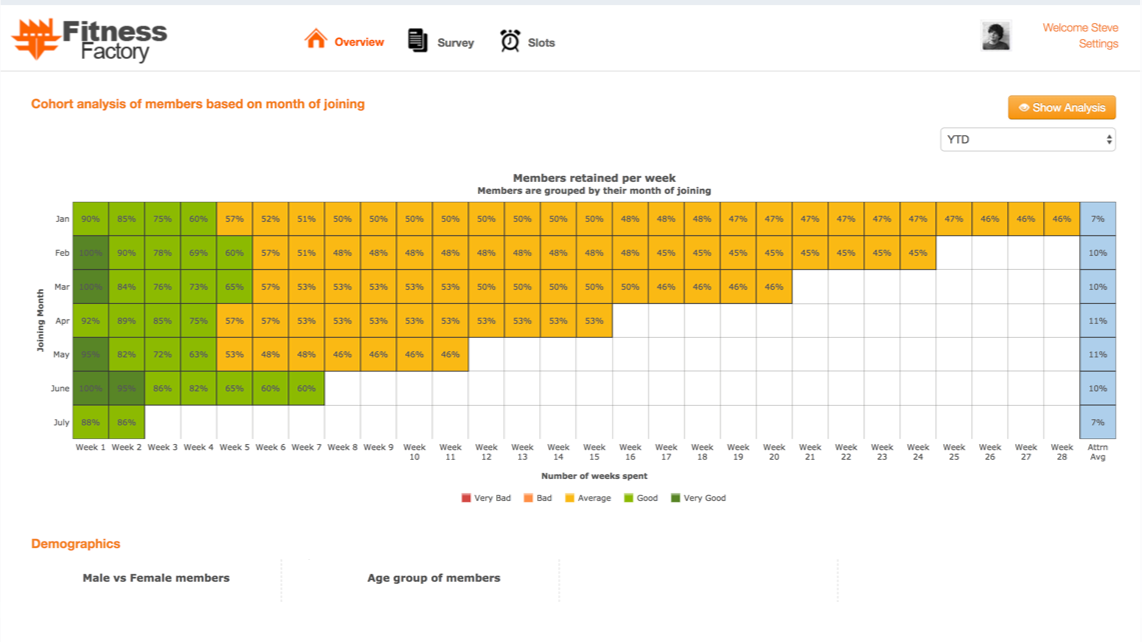
Membership Monitoring Dashboard
Analyze attrition & retention rates at your business, and understand member demographics, preferred visit times, campaign impacts, and more.