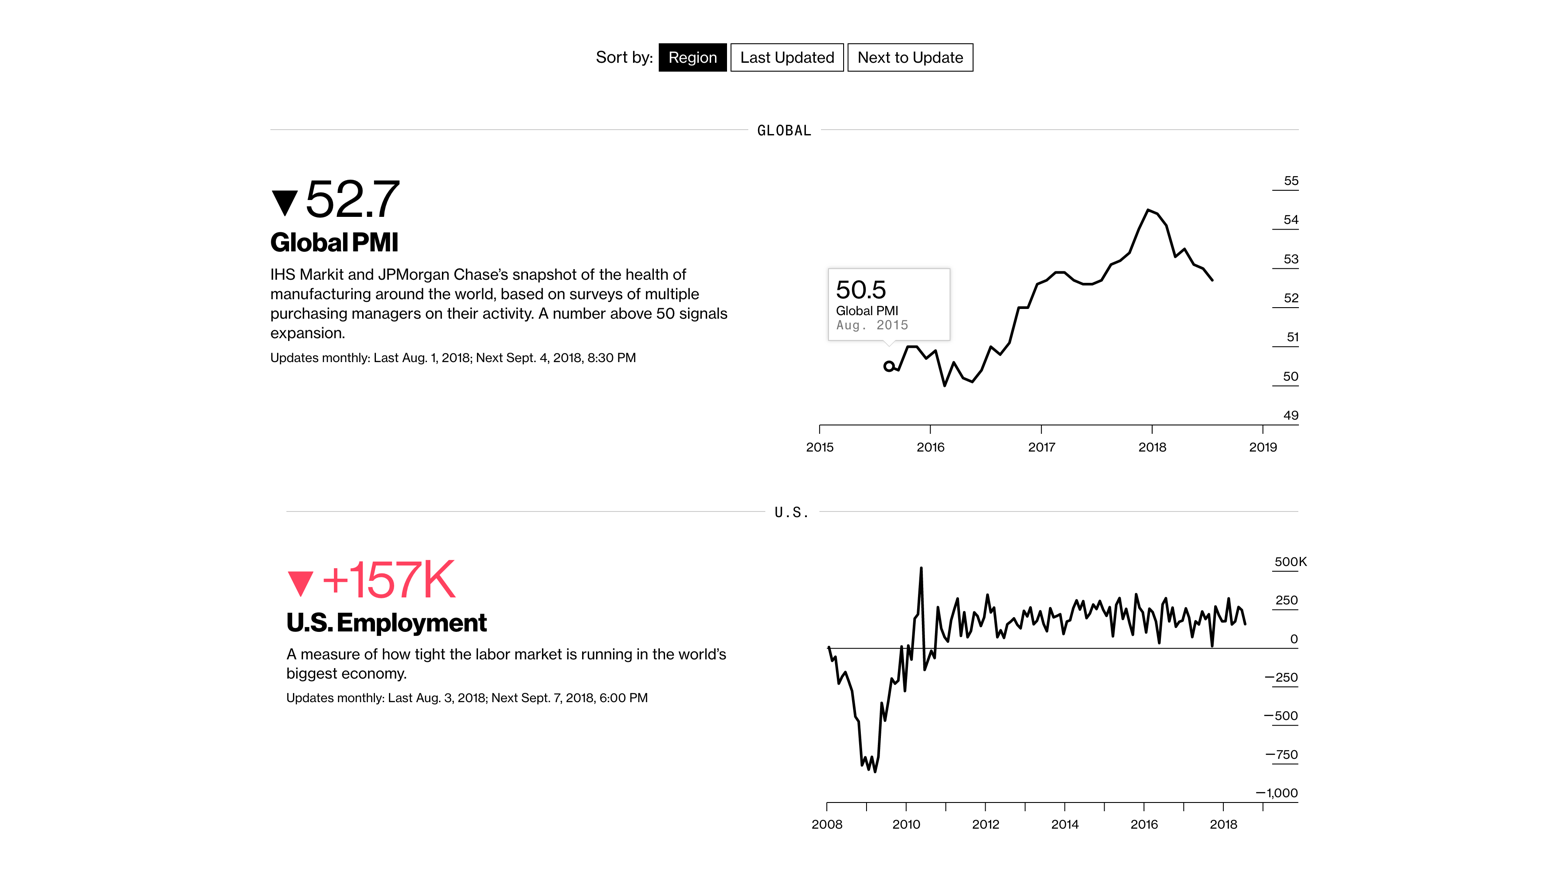
Twelve Global Economic Indicators to Watch
Data Story by FusionCharts

Story being told
Understanding every twist and turn in the $90 trillion global economy could be a challenge, isn’t it? Not anymore. This story subtly shows the trend of key economic indicators from every corner of the world. It helps one know the different pangs of expansion and recession which has happened in the global economy in the last decade.
Original @
Bloomberg
View this Data Story
This sample dashboard is built using FusionCharts Suite XT, which needs a license for commercial use.
Want to use this Data Story in your projects?
We can plug in your data into our data story templates, or customize the template for your needs, or even build a completely new one. We would love to talk to you!