Sales Dashboard
Features:
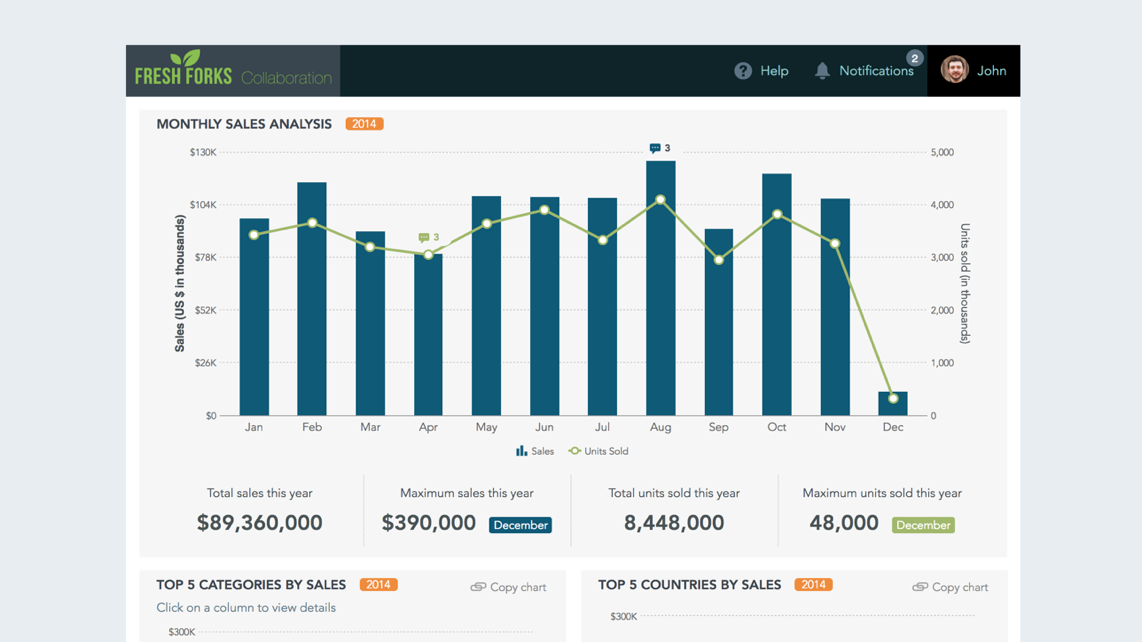
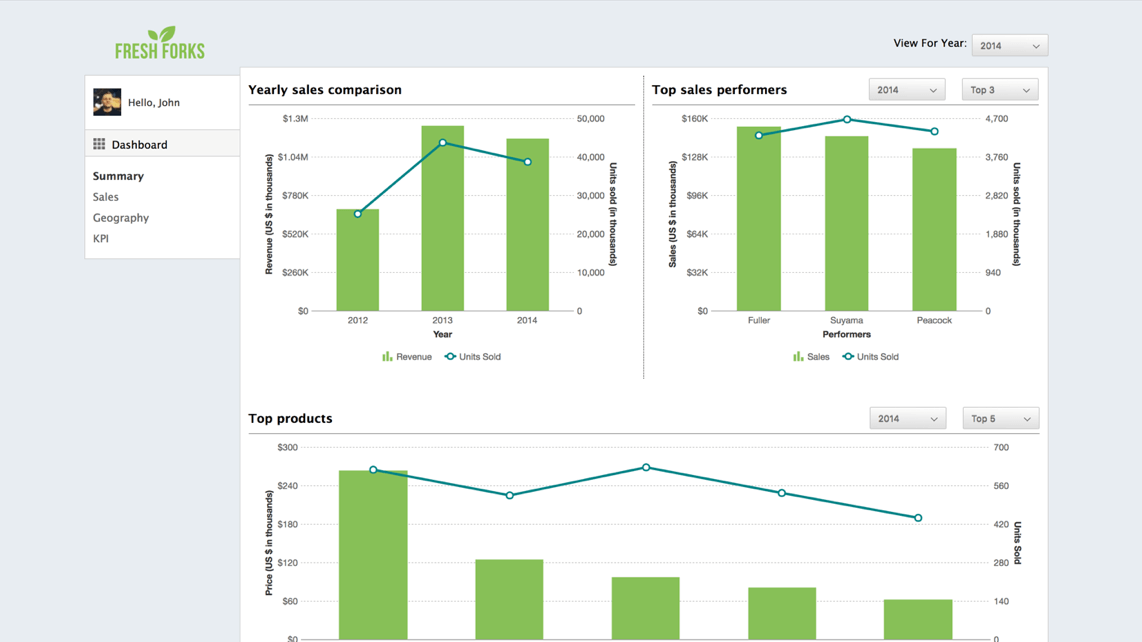
- Track the revenue generated on a quarterly and yearly basis
- Shows the performance of sales funnel on a monthly basis in terms of Opportunities, Pipeline and Closed
- Know the global sales distribution in terms of opportunities closed
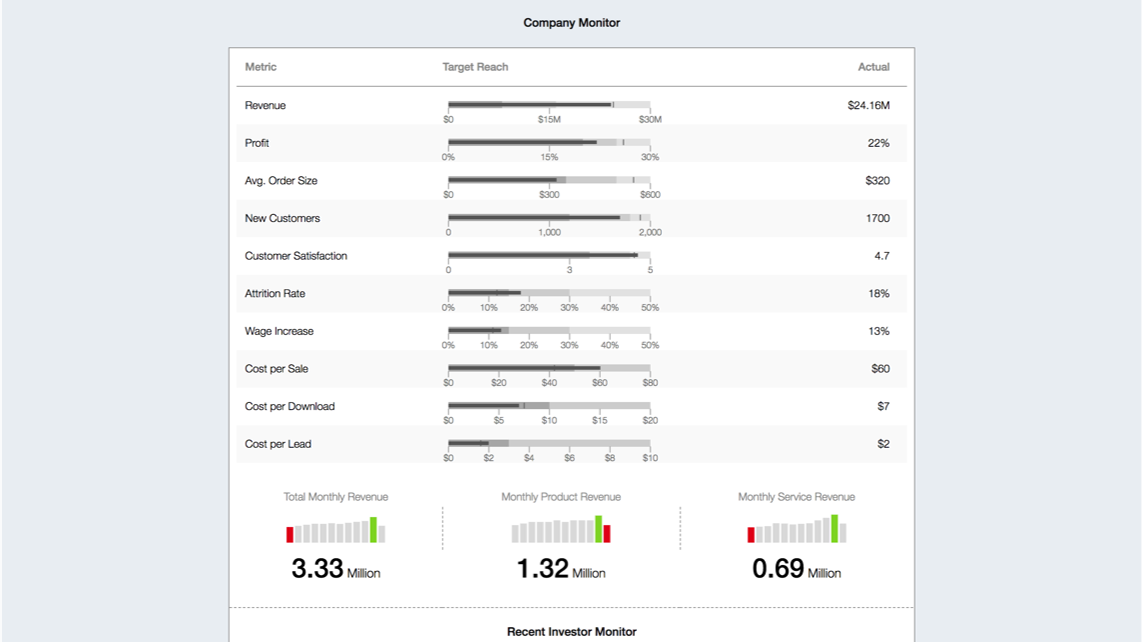
- Evaluate the sales life-cycle based on the KPIs like Revenue Target, Revenue Achieved, Pipeline Value, Opportunities and Leads
- Know the clear-cut targets for deals in pipeline to the opportunities in pipeline and opportunities sourced to leads converted
Technologies used:
- React JS
- React-FusionCharts wrapper
Products from FusionCharts used:
- FusionCharts XT
- FusionMaps XT
Similar Dashboards

Business Operation Monitoring Dashboard
Track intra-organizational KPIs, monitor functional metrics (sales, marketing, HR, and more), and trump competition using competitor metrics...

Sales & Collaboration Dashboard
Simplify business collaboration with our Sales & Collaboration Dashboard, bringing the ease and engagement of social media into workplace co...

Sales Managemnt Dashboard
View important sales numbers with our Sales Management Dashboard. Log in with a unique user id & password to gain access to key company info...
